Trang này cho biết cách truy cập vào một tập dữ liệu theo phương thức lập trình và tạo kiểu cho các đối tượng của tập dữ liệu đó, đồng thời trình bày các ví dụ về việc tạo kiểu cho các đối tượng dữ liệu dựa trên hình học điểm, đa giác và đường nhiều đoạn.
Tính năng tạo kiểu dựa trên dữ liệu cho tập dữ liệu hiển thị các đối tượng dữ liệu dựa trên vĩ độ và kinh độ được cung cấp từ tệp dữ liệu không gian địa lý dùng để tạo tập dữ liệu.
Ví dụ về kiểu dữ liệu điểm
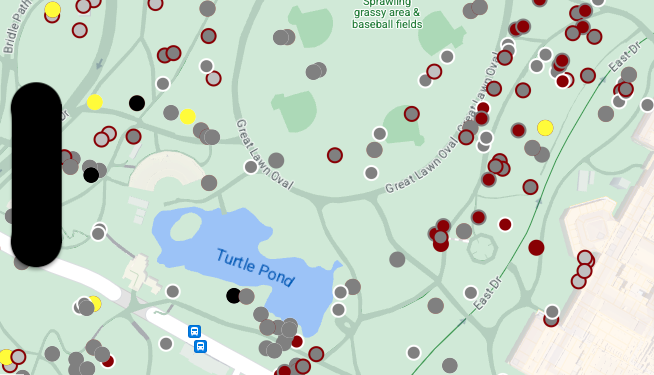
Ví dụ này minh hoạ một phương pháp tạo kiểu cho các đối tượng dữ liệu dựa trên hình học điểm.

Giới thiệu về tập dữ liệu
Tập dữ liệu được dùng trong ví dụ này là kết quả của một cuộc khảo sát năm 2018 về sóc ở Công viên Trung tâm, Thành phố New York.
Trong đoạn trích sau đây từ tệp dữ liệu CSV, chúng ta thấy rằng các cột x và y được dùng cho địa lý; cột LatLng được đưa vào nhưng không được dùng trong ví dụ này vì các tập dữ liệu chỉ hỗ trợ định dạng WKT nếu cột có tên là WKT. Để biết thêm thông tin về các định dạng được hỗ trợ cho vị trí, hãy xem các yêu cầu đối với CSV.
Tập dữ liệu về số lượng sóc có nhiều điểm dữ liệu khác nhau liên quan đến màu lông và hành vi được quan sát của sóc (hãy nhớ di chuyển theo chiều ngang để xem tất cả).
| X | Có | UniqueSquirrelID | Hecta | Shift | Ngày | Hectare SquirrelNumber | Độ tuổi | PrimaryFurColor | HighlightFurColor | CombinationofPrimaryandHighlightColor | Colornotes | Thông tin vị trí | Đo lường AboveGroundSighter | SpecificLocation | Đang chạy | Chasing | Leo núi | Ăn | Tìm kiếm thức ăn | Hoạt động khác | Kuks | Quaas | Tiếng rên rỉ | Tailflags | Tailtwitches | Phương pháp | Trung lập | Runsfrom | OtherInteractions | LatLng |
|---|---|---|---|---|---|---|---|---|---|---|---|---|---|---|---|---|---|---|---|---|---|---|---|---|---|---|---|---|---|---|
| -73.9561344937861 | 40,7940823884086 | 37F-PM-1014-03 | 37F | CH | 10142018 | 3 | + | false | false | false | false | false | false | false | false | false | false | false | false | false | POINT (-73.9561344937861 40.7940823884086) | |||||||||
| -73,9688574691102 | 40.7837825208444 | 21B-AM-1019-04 | 21 tỷ | SA | 10192018 | 4 | + | false | false | false | false | false | false | false | false | false | false | false | false | false | POINT (-73.9688574691102 40.7837825208444) | |||||||||
| -73,9742811484852 | 40,775533619083 | 11B-PM-1014-08 | 11B | CH | 10142018 | 8 | Xám | Gray+ | Nổi | 10 | false | true | false | false | false | false | false | false | false | false | false | false | false | POINT (-73.97428114848522 40.775533619083) | ||||||
| -73,9596413903948 | 40.7903128889029 | 32E-PM-1017-14 | 32E | CH | 10172018 | 14 | Người lớn | Xám | Gray+ | Chưa chọn mục nào làm mục chính. Đánh dấu màu xám là Khoảnh khắc nổi bật. Đã điều chỉnh theo yêu cầu của cấp trên. | false | false | false | true | true | false | false | false | false | false | false | false | true | POINT (-73.9596413903948 40.7903128889029) | ||||||
| -73,9702676472613 | 40.7762126854894 | 13E-AM-1017-05 | 13E | SA | 10172018 | 5 | Người lớn | Xám | Cây quế | Xám + Quế | Nổi | trên gốc cây | false | false | false | false | true | false | false | false | false | false | false | false | false | POINT (-73.9702676472613 40.7762126854894) | ||||
| -73,9683613516225 | 40,7725908847499 | 11H-AM-1010-03 | 11H | SA | 10102018 | 3 | Người lớn | Cây quế | Trắng | Quế + Trắng | false | false | false | false | true | false | false | false | false | true | false | true | false | POINT (-73.9683613516225 40.7725908847499) | ||||||
| -73,9541201789795 | 40,7931811701082 | 36H-AM-1010-02 | 36H | SA | 10102018 | 2 | Người lớn | Xám | Gray+ | chỉ cách hecta một chút | Mặt phẳng tiếp đất | FALSE | false | false | false | false | true | false | false | false | false | false | false | false | false | POINT (-73.9541201789795 40.7931811701082) |
Tạo kiểu cho các đối tượng dữ liệu điểm
Mã trong ví dụ này sử dụng phương pháp tạo kiểu cho màu tô và màu nét của từng điểm dựa trên thuộc tính CombinationofPrimaryandHighlightColor. Thuộc tính này kết hợp màu lông chính và màu lông phụ cho từng con sóc.
Swift
let mapView = GMSMapView(frame: .zero, mapID: GMSMapID(identifier: "YOUR_MAP_ID"), camera: GMSCameraPosition(latitude: 40.7, longitude: -74.0, zoom: 12))

let layer = mapView.datasetFeatureLayer(of: "YOUR_DATASET_ID")

// Define a point style with fill and radius.
// Apply the style to the datasets features.
layer.style = { feature in
    switch(feature.datasetAttributes["CombinationofPrimaryandHighlightColor"]){
      case "Black+"  :
        let style = MutableFeatureStyle()
        style.fillColor = .black;
        style.pointRadius = 8;
        return style
      case "Cinnamon+"  :
        let style = MutableFeatureStyle()
        style.fillColor = UIColor(red: 139/255, green: 0, blue: 0, alpha: 1);
        style.pointRadius = 8;
        return style
      ...
      default :
        let style = MutableFeatureStyle()
        style.fillColor = .yellow;
        style.pointRadius = 8;
        return style
    }
}
Objective-C
GMSMapView *mapView = [GMSMapView mapWithFrame:CGRectZero mapID:[GMSMapID mapIDWithIdentifier:@"MAP_ID"] camera:[GMSCameraPosition cameraWithLatitude: 40.7 longitude: -74.0 zoom:12]];

GMSDatasetFeatureLayer *layer = [mapView datasetFeatureLayerOfDatasetID:@"YOUR_DATASET_ID"];

// Define a point style with fill and radius.
// Apply the style to the datasets features.
layer.style = ^(GMSDatasetFeature *feature) {
  NSString *attrib = feature.datasetAttributes[@"CombinationofPrimaryandHighlightColor"];
  if ([attrib isEqualToString:@"Black+"])  {
    GMSMutableFeatureStyle *style = [GMSMutableFeatureStyle style];
    style.fillColor = [UIColor blackColor];
    style.pointRadius = 8;
    return style;
  } else if([attrib isEqualToString:@"Cinnamon+"]) {
    GMSMutableFeatureStyle *style = [GMSMutableFeatureStyle style];
    style.fillColor = [UIColor colorWithRed:139.0f/255.0f
                                      green:0.0f
                                        blue:0.0f
                                      alpha:1.0f];
    style.pointRadius = 8;
    return style;
  }
  ...
  else {
    GMSMutableFeatureStyle *style = [GMSMutableFeatureStyle style];
    style.fillColor = [UIColor yellowColor];
    style.pointRadius = 8;
    return style;
  }
};
Ví dụ về kiểu dữ liệu đa giác
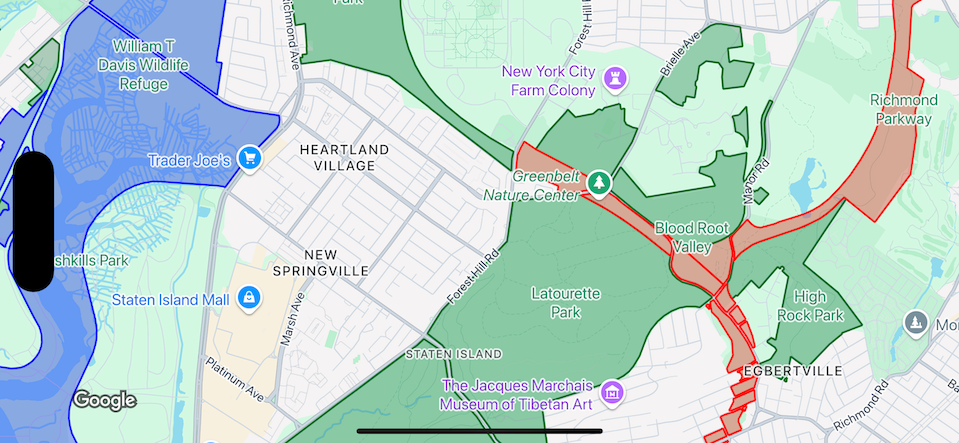
Ví dụ này minh hoạ một phương pháp tạo kiểu cho các đối tượng dữ liệu dựa trên hình học đa giác.

Giới thiệu về tập dữ liệu
Tập dữ liệu được dùng trong ví dụ này mô tả các công viên ở Thành phố New York. Đoạn trích sau đây trong tệp GeoJSON của tập dữ liệu cho thấy một mục nhập đối tượng đại diện.
{
  "type": "Feature",
  "properties": {
    "jurisdiction": "DPR",
    "mapped": "False",
    "zipcode": "11356",
    "acres": "0.05",
    "location": "College Pl., College Pt. Blvd., bet. 11 Ave. and 12 Ave.",
    "nys_assembly": "27",
    "councildistrict": "19",
    "url": "http://www.nycgovparks.org/parks/Q042/",
    "typecategory": "Triangle/Plaza",
    "us_congress": "14",
    "eapply": "Poppenhusen Park",
    "parentid": "Q-07",
    "gispropnum": "Q042",
    "retired": "false",
    "communityboard": "407",
    "objectid": "6248",
    "globalid": "F4810079-CBB9-4BE7-BBFA-B3C0C35D5DE5",
    "name311": "Poppenhusen Park",
    "department": "Q-07",
    "pip_ratable": "true",
    "subcategory": "Sitting Area/Triangle/Mall",
    "precinct": "109",
    "permit": "true",
    "acquisitiondate": null,
    "omppropid": "Q042",
    "gisobjid": "100000301",
    "signname": "Poppenhusen Park",
    "address": null,
    "permitparent": "Q-07",
    "class": "PARK",
    "nys_senate": "11",
    "permitdistrict": "Q-07",
    "borough": "Q",
    "waterfront": "false"
  },
  "geometry": {
    "type": "MultiPolygon",
    "coordinates": [
      [
        [
          [
            -73.84575702371716,
            40.78796240884273
          ],
          [
            -73.84593393292693,
            40.78796857347548
          ],
          [
            -73.84577256469657,
            40.787651355629556
          ],
          [
            -73.84575702371716,
            40.78796240884273
          ]
        ]
      ]
    ]
  }
},
Tạo kiểu cho các đối tượng dữ liệu đa giác
Mã trong ví dụ này áp dụng màu sắc đặc biệt cho các đối tượng dữ liệu được liên kết với typecategory có giá trị "Chưa phát triển" hoặc "Đường cao tốc" và tô màu xanh lục cho tất cả các đối tượng khác.
Swift
let mapView = GMSMapView(frame: .zero, mapID: GMSMapID(identifier: "YOUR_MAP_ID"), camera: GMSCameraPosition(latitude: 40.7, longitude: -74.0, zoom: 12))

let layer = mapView.datasetFeatureLayer(of: "YOUR_DATASET_ID")

// Define a polygon style with fill and stroke.
// Apply the style to the datasets features.
layer.style = { feature in
  switch(feature.datasetAttributes["typecategory"]){
    case "Undeveloped"  :
      let style = MutableFeatureStyle()
      style.fillColor = .blue.withAlphaComponent(0.3);
      style.strokeColor = .blue;
      style.strokeWidth = 2.0;
      return style
    case "Parkway"  :
      let style = MutableFeatureStyle()
      style.fillColor = .red.withAlphaComponent(0.3);
      style.strokeColor = .red;
      style.strokeWidth = 2.0;
      return style
    default :
      let style = MutableFeatureStyle()
      style.fillColor = .green.withAlphaComponent(0.3);
      style.strokeColor = .green;
      style.strokeWidth = 2.0;
      return style
  }
}
Objective-C
GMSMapView *mapView = [GMSMapView mapWithFrame:CGRectZero mapID:[GMSMapID mapIDWithIdentifier:@"MAP_ID"] camera:[GMSCameraPosition cameraWithLatitude: 40.7 longitude: -74.0 zoom:12]];

GMSDatasetFeatureLayer *layer = [mapView datasetFeatureLayerOfDatasetID:@"YOUR_DATASET_ID"];

// Define a polygon style with fill and stroke.
// Apply the style to the datasets features.
layer.style = ^(GMSDatasetFeature *feature) {
  NSString *attrib = feature.datasetAttributes[@"typecategory"];
  if ([attrib isEqualToString:@"Undeveloped"]) {
        GMSMutableFeatureStyle *style = [GMSMutableFeatureStyle style];
        style.fillColor = [[UIColor blueColor] colorWithAlphaComponent:0.3];
        style.strokeColor = [UIColor blueColor];
        style.strokeWidth = 2.0;
        return style;
  } else if([attrib isEqualToString:@"Parkway"]) {
        GMSMutableFeatureStyle *style = [GMSMutableFeatureStyle style];
        style.fillColor = [[UIColor redColor] colorWithAlphaComponent:0.3];
        style.strokeColor = [UIColor redColor];
        style.strokeWidth = 2.0;
        return style;
  } else {
        GMSMutableFeatureStyle *style = [GMSMutableFeatureStyle style];
        style.fillColor = [[UIColor greenColor] colorWithAlphaComponent:0.3];
        style.strokeColor = [UIColor greenColor];
        style.strokeWidth = 2.0;
        return style;
    }
  };
Ví dụ về kiểu dữ liệu đường nhiều đoạn
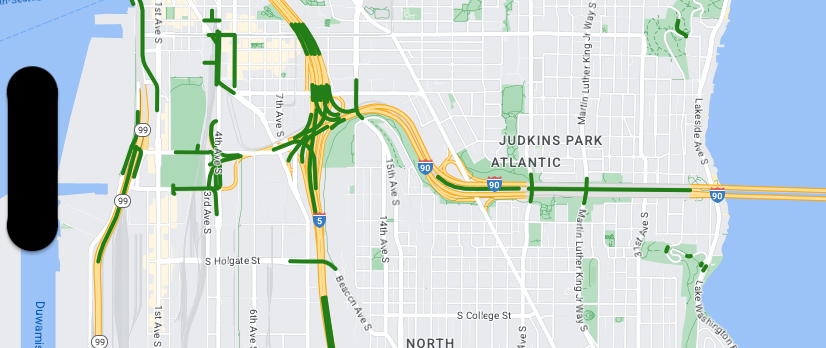
Ví dụ này minh hoạ một phương pháp tạo kiểu cho các đối tượng dữ liệu hình học đường nhiều đoạn.

Giới thiệu về tập dữ liệu
Tập dữ liệu được dùng trong ví dụ này cho thấy các cây cầu trong khu vực Seattle. Đoạn trích sau đây trong tệp GeoJSON của tập dữ liệu cho thấy một mục nhập đối tượng đại diện.
{
  "type": "Feature",
  "properties": {
      "OBJECTID": 1,
      "COMPTYPE": 66,
      "COMPKEY": 515774,
      "HANSEGKEY": 489781,
      "UNITID": "BRG-935",
      "UNITTYPE": " ",
      "BRGUNITID": "BRG-935",
      "UNITDESC_BRG": "YALE AVE BR REV LANE OC                                                                                                                                                                                                                                        ",
      "UNITDESC_SEG": "HOWELL ST ON RP BETWEEN HOWELL ST AND I5 SB                                                                                                                                                                                                                    ",
      "INSTDATE": null,
      "EXPDATE": null,
      "STATUS": " ",
      "STATUSDT": null,
      "CONDITION": " ",
      "CONDDT": null,
      "OWN": " ",
      "LSTVERIFY": null,
      "MAINTBY": " ",
      "ADDBY": "GARCIAA",
      "ADDDTTM": "2010-01-21T00:00:00Z",
      "MODBY": null,
      "MODDTTM": null,
      "BR_NBR": 935,
      "BR_CODE": " 935",
      "BR_TYPE": "ST",
      "BR_NAME": "YALE AVE BR REV LANE OC",
      "BR_FACILITIES": "YALE AVE-SR 5 ON RAMP",
      "BR_FEATURES": "SR 5 REV LANE",
      "BR_RATING": 0,
      "BR_INSET": 1,
      "BR_GEO": "DT",
      "BR_OWNER": "DOT",
      "BR_OWNER_NAME": "State of Washington",
      "GEOBASID": 0,
      "XGEOBASID": 0,
      "GISSEGKEY": 489781,
      "EARTHQUAKE_RESPONSE_TEAM": " ",
      "SHAPE_Length": 220.11891836147655
  },
  "geometry": {
      "type": "LineString",
      "coordinates": [
          [
              -122.329201929090928,
              47.616910448708538
          ],
          [
              -122.329206483407461,
              47.616976719821004
          ],
          [
              -122.32921802149356,
              47.617042137515213
          ],
          [
              -122.329236413912909,
              47.617105967923777
          ],
          [
              -122.329261454336034,
              47.617167494985758
          ],
          [
              -122.329292861855023,
              47.617226028479571
          ],
          [
              -122.329330284134699,
              47.617280911766009
          ],
          [
              -122.329373301365223,
              47.617331529154569
          ],
          [
              -122.329421430971635,
              47.617377312810319
          ],
          [
              -122.329474133027375,
              47.617417749124023
          ],
          [
              -122.32953081631139,
              47.617452384473893
          ]
      ]
  }
},
Tạo kiểu cho các đối tượng dữ liệu nhiều đường
Đoạn mã sau đây áp dụng cùng một kiểu trực tiếp cho tất cả các đối tượng dữ liệu.
Swift
// Define a style with green fill and stroke.
// Apply the style to the datasets features.
layer.style = { feature in
  let style = MutableFeatureStyle()
  style.fillColor = .green.withAlphaComponent(0.5);
  style.strokeColor = [UIColor greenColor];
  style.strokeWidth = 2.0;
  return style
}
Objective-C
// Define a style with green fill and stroke.
// Apply the style to the datasets features.
layer.style = ^(GMSDatasetFeature *feature) {
  GMSMutableFeatureStyle *style = [GMSMutableFeatureStyle style];
  style.fillColor = [[UIColor greenColor] colorWithAlphaComponent:0.5];
  style.strokeColor = [UIColor greenColor];
  style.strokeWidth = 2.0;
  return style;
};
