
توضّح هذه الصفحة كيفية الوصول إلى مجموعة بيانات وتصميم عناصرها برمجيًا، كما تقدّم أمثلة على تصميم عناصر البيانات استنادًا إلى أشكال هندسية من النقاط والمضلّعات والخطوط المتعددة.
تعرض ميزة "التصميم المستند إلى البيانات" لمجموعات البيانات عناصر البيانات استنادًا إلى إحداثيات خطوط الطول والعرض المقدَّمة من ملف البيانات الجغرافية المكانية المستخدَم لإنشاء مجموعة البيانات.
مثال على تصميم بيانات النقاط
يوضّح هذا المثال طريقة لتصميم ميزات البيانات المستندة إلى هندسة النقاط.
لمحة عن مجموعة البيانات
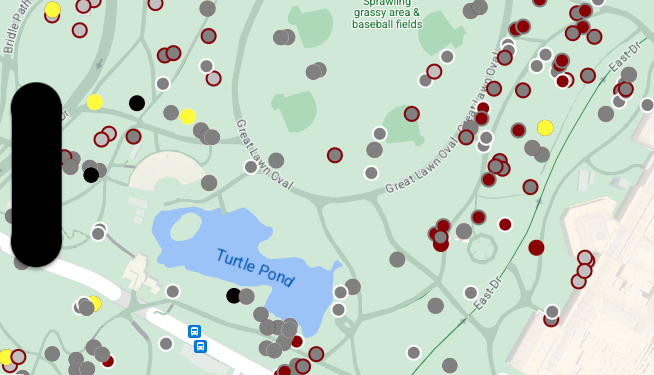
مجموعة البيانات المستخدَمة في هذا المثال هي نتيجة استطلاع أُجري عام 2018 حول السناجب في "سنترال بارك" بمدينة نيويورك.
في المقتطف التالي من ملف بيانات CSV، نرى أنّ العمودين x وy
يُستخدمان للجغرافيا، وتم تضمين العمود LatLng، ولكن لا يتم استخدامه في هذا المثال لأنّ مجموعات البيانات لا تتوافق إلا مع
تنسيق WKT
إذا كان اسم العمود هو WKT. لمزيد من المعلومات حول التنسيقات المتوافقة مع الموقع الجغرافي، يُرجى الاطّلاع على متطلبات ملف CSV.
تحتوي مجموعة بيانات إحصاء السناجب على مجموعة متنوعة من نقاط البيانات المختلفة المتعلقة بلون الفراء والسلوك المرصودين للسناجب (احرص على التمرير أفقيًا للاطّلاع على كل البيانات).
| X | نعم | UniqueSquirrelID | هكتار | Shift | التاريخ | Hectare SquirrelNumber | العمر | PrimaryFurColor | HighlightFurColor | CombinationofPrimaryandHighlightColor | Colornotes | الموقع الجغرافي | AboveGroundSighter Measurement | SpecificLocation | ركض | المطاردة | تسلق | تناول الطعام | البحث عن الطعام | الأنشطة الأخرى | Kuks | Quaas | Moans | Tailflags | Tailtwitches | الأساليب | حيادية | Runsfrom | OtherInteractions | LatLng |
|---|---|---|---|---|---|---|---|---|---|---|---|---|---|---|---|---|---|---|---|---|---|---|---|---|---|---|---|---|---|---|
| -73.9561344937861 | 40.7940823884086 | 37F-PM-1014-03 | 37F | مساءً | 10142018 | 3 | + | خطأ | خطأ | خطأ | خطأ | خطأ | خطأ | خطأ | خطأ | خطأ | خطأ | خطأ | خطأ | خطأ | POINT (-73.9561344937861 40.7940823884086) | |||||||||
| -73.9688574691102 | 40.7837825208444 | 21B-AM-1019-04 | 21 مليار | صباحًا | 10192018 | 4 | + | خطأ | خطأ | خطأ | خطأ | خطأ | خطأ | خطأ | خطأ | خطأ | خطأ | خطأ | خطأ | خطأ | POINT (-73.9688574691102 40.7837825208444) | |||||||||
| -73.9742811484852 | 40.775533619083 | 11B-PM-1014-08 | 11B | مساءً | 10142018 | 8 | رمادي | Gray+ | فوق الأرض | 10 | خطأ | صحيح | خطأ | خطأ | خطأ | خطأ | خطأ | خطأ | خطأ | خطأ | خطأ | خطأ | خطأ | POINT (-73.97428114848522 40.775533619083) | ||||||
| -73.9596413903948 | 40.7903128889029 | 32E-PM-1017-14 | 32E | مساءً | 10172018 | 14 | للبالغين | رمادي | Gray+ | لم يتم اختيار أي عنصر كعنصر أساسي. تم اختيار اللون الرمادي كلون التمييز. إجراء تعديلات تنفيذية | خطأ | خطأ | خطأ | صحيح | صحيح | خطأ | خطأ | خطأ | خطأ | خطأ | خطأ | خطأ | صحيح | POINT (-73.9596413903948 40.7903128889029) | ||||||
| -73.9702676472613 | 40.7762126854894 | 13E-AM-1017-05 | 13E | صباحًا | 10172018 | 5 | للبالغين | رمادي | قرفة | رمادي+قرفة | فوق الأرض | على جذع شجرة | خطأ | خطأ | خطأ | خطأ | صحيح | خطأ | خطأ | خطأ | خطأ | خطأ | خطأ | خطأ | خطأ | POINT (-73.9702676472613 40.7762126854894) | ||||
| -73.9683613516225 | 40.7725908847499 | 11H-AM-1010-03 | 11H | صباحًا | 10102018 | 3 | للبالغين | قرفة | أبيض | قرفة+أبيض | خطأ | خطأ | خطأ | خطأ | صحيح | خطأ | خطأ | خطأ | خطأ | صحيح | خطأ | صحيح | خطأ | POINT (-73.9683613516225 40.7725908847499) | ||||||
| -73.9541201789795 | 40.7931811701082 | 36H-AM-1010-02 | 36H | صباحًا | 10102018 | 2 | للبالغين | رمادي | Gray+ | خارج الهكتار مباشرةً | Ground Plane | خطأ | خطأ | خطأ | خطأ | خطأ | صحيح | خطأ | خطأ | خطأ | خطأ | خطأ | خطأ | خطأ | خطأ | POINT (-73.9541201789795 40.7931811701082) |
ميزات بيانات النقاط المتعلقة بالأسلوب
تتّبع التعليمة البرمجية في هذا المثال أسلوبًا لتصميم لون التعبئة ولون الحد لكل نقطة استنادًا إلى السمة CombinationofPrimaryandHighlightColor، التي تجمع بين ألوان الفراء الأساسية والثانوية لكل سنجاب.
Swift
let mapView = GMSMapView(frame: .zero, mapID: GMSMapID(identifier: "YOUR_MAP_ID"), camera: GMSCameraPosition(latitude: 40.7, longitude: -74.0, zoom: 12))

let layer = mapView.datasetFeatureLayer(of: "YOUR_DATASET_ID")

// Define a point style with fill and radius.
// Apply the style to the datasets features.
layer.style = { feature in
    switch(feature.datasetAttributes["CombinationofPrimaryandHighlightColor"]){
      case "Black+"  :
        let style = MutableFeatureStyle()
        style.fillColor = .black;
        style.pointRadius = 8;
        return style
      case "Cinnamon+"  :
        let style = MutableFeatureStyle()
        style.fillColor = UIColor(red: 139/255, green: 0, blue: 0, alpha: 1);
        style.pointRadius = 8;
        return style
      ...
      default :
        let style = MutableFeatureStyle()
        style.fillColor = .yellow;
        style.pointRadius = 8;
        return style
    }
}
Objective-C
GMSMapView *mapView = [GMSMapView mapWithFrame:CGRectZero mapID:[GMSMapID mapIDWithIdentifier:@"MAP_ID"] camera:[GMSCameraPosition cameraWithLatitude: 40.7 longitude: -74.0 zoom:12]];

GMSDatasetFeatureLayer *layer = [mapView datasetFeatureLayerOfDatasetID:@"YOUR_DATASET_ID"];

// Define a point style with fill and radius.
// Apply the style to the datasets features.
layer.style = ^(GMSDatasetFeature *feature) {
  NSString *attrib = feature.datasetAttributes[@"CombinationofPrimaryandHighlightColor"];
  if ([attrib isEqualToString:@"Black+"])  {
    GMSMutableFeatureStyle *style = [GMSMutableFeatureStyle style];
    style.fillColor = [UIColor blackColor];
    style.pointRadius = 8;
    return style;
  } else if([attrib isEqualToString:@"Cinnamon+"]) {
    GMSMutableFeatureStyle *style = [GMSMutableFeatureStyle style];
    style.fillColor = [UIColor colorWithRed:139.0f/255.0f
                                      green:0.0f
                                        blue:0.0f
                                      alpha:1.0f];
    style.pointRadius = 8;
    return style;
  }
  ...
  else {
    GMSMutableFeatureStyle *style = [GMSMutableFeatureStyle style];
    style.fillColor = [UIColor yellowColor];
    style.pointRadius = 8;
    return style;
  }
};
مثال على تصميم بيانات المضلّعات
يوضّح هذا المثال طريقة لتصميم عناصر بيانات هندسة المضلّعات.
لمحة عن مجموعة البيانات
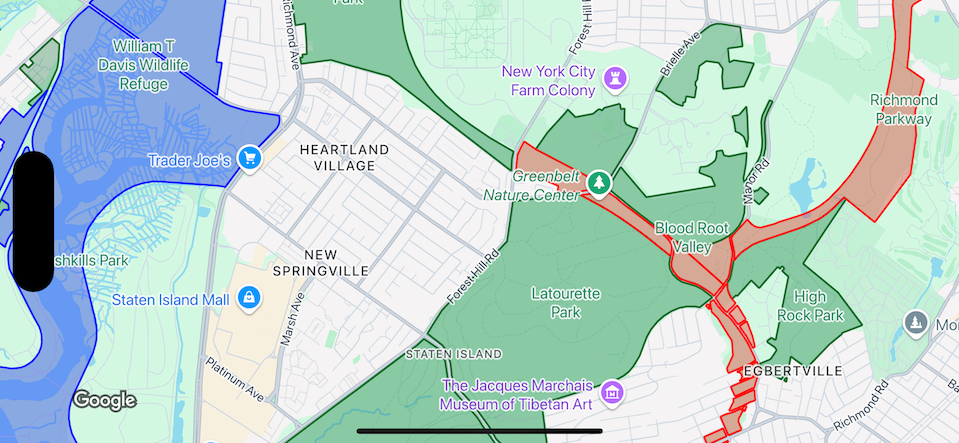
تعرض مجموعة البيانات المستخدَمة في هذا المثال المتنزهات في مدينة نيويورك. يعرض المقتطف التالي من ملف GeoJSON لمجموعة البيانات إدخالاً تمثيليًا للميزة.
{
  "type": "Feature",
  "properties": {
    "jurisdiction": "DPR",
    "mapped": "False",
    "zipcode": "11356",
    "acres": "0.05",
    "location": "College Pl., College Pt. Blvd., bet. 11 Ave. and 12 Ave.",
    "nys_assembly": "27",
    "councildistrict": "19",
    "url": "http://www.nycgovparks.org/parks/Q042/",
    "typecategory": "Triangle/Plaza",
    "us_congress": "14",
    "eapply": "Poppenhusen Park",
    "parentid": "Q-07",
    "gispropnum": "Q042",
    "retired": "false",
    "communityboard": "407",
    "objectid": "6248",
    "globalid": "F4810079-CBB9-4BE7-BBFA-B3C0C35D5DE5",
    "name311": "Poppenhusen Park",
    "department": "Q-07",
    "pip_ratable": "true",
    "subcategory": "Sitting Area/Triangle/Mall",
    "precinct": "109",
    "permit": "true",
    "acquisitiondate": null,
    "omppropid": "Q042",
    "gisobjid": "100000301",
    "signname": "Poppenhusen Park",
    "address": null,
    "permitparent": "Q-07",
    "class": "PARK",
    "nys_senate": "11",
    "permitdistrict": "Q-07",
    "borough": "Q",
    "waterfront": "false"
  },
  "geometry": {
    "type": "MultiPolygon",
    "coordinates": [
      [
        [
          [
            -73.84575702371716,
            40.78796240884273
          ],
          [
            -73.84593393292693,
            40.78796857347548
          ],
          [
            -73.84577256469657,
            40.787651355629556
          ],
          [
            -73.84575702371716,
            40.78796240884273
          ]
        ]
      ]
    ]
  }
},
تنسيق عناصر بيانات المضلّعات
يطبّق الرمز البرمجي في هذا المثال تلوينًا خاصًا على ميزات البيانات المرتبطة typecategory بقيمة "غير مطوَّر" أو "طريق سريع"، ويلوّن جميع الميزات الأخرى باللون الأخضر.
Swift
let mapView = GMSMapView(frame: .zero, mapID: GMSMapID(identifier: "YOUR_MAP_ID"), camera: GMSCameraPosition(latitude: 40.7, longitude: -74.0, zoom: 12))

let layer = mapView.datasetFeatureLayer(of: "YOUR_DATASET_ID")

// Define a polygon style with fill and stroke.
// Apply the style to the datasets features.
layer.style = { feature in
  switch(feature.datasetAttributes["typecategory"]){
    case "Undeveloped"  :
      let style = MutableFeatureStyle()
      style.fillColor = .blue.withAlphaComponent(0.3);
      style.strokeColor = .blue;
      style.strokeWidth = 2.0;
      return style
    case "Parkway"  :
      let style = MutableFeatureStyle()
      style.fillColor = .red.withAlphaComponent(0.3);
      style.strokeColor = .red;
      style.strokeWidth = 2.0;
      return style
    default :
      let style = MutableFeatureStyle()
      style.fillColor = .green.withAlphaComponent(0.3);
      style.strokeColor = .green;
      style.strokeWidth = 2.0;
      return style
  }
}
Objective-C
GMSMapView *mapView = [GMSMapView mapWithFrame:CGRectZero mapID:[GMSMapID mapIDWithIdentifier:@"MAP_ID"] camera:[GMSCameraPosition cameraWithLatitude: 40.7 longitude: -74.0 zoom:12]];

GMSDatasetFeatureLayer *layer = [mapView datasetFeatureLayerOfDatasetID:@"YOUR_DATASET_ID"];

// Define a polygon style with fill and stroke.
// Apply the style to the datasets features.
layer.style = ^(GMSDatasetFeature *feature) {
  NSString *attrib = feature.datasetAttributes[@"typecategory"];
  if ([attrib isEqualToString:@"Undeveloped"]) {
        GMSMutableFeatureStyle *style = [GMSMutableFeatureStyle style];
        style.fillColor = [[UIColor blueColor] colorWithAlphaComponent:0.3];
        style.strokeColor = [UIColor blueColor];
        style.strokeWidth = 2.0;
        return style;
  } else if([attrib isEqualToString:@"Parkway"]) {
        GMSMutableFeatureStyle *style = [GMSMutableFeatureStyle style];
        style.fillColor = [[UIColor redColor] colorWithAlphaComponent:0.3];
        style.strokeColor = [UIColor redColor];
        style.strokeWidth = 2.0;
        return style;
  } else {
        GMSMutableFeatureStyle *style = [GMSMutableFeatureStyle style];
        style.fillColor = [[UIColor greenColor] colorWithAlphaComponent:0.3];
        style.strokeColor = [UIColor greenColor];
        style.strokeWidth = 2.0;
        return style;
    }
  };
مثال على تصميم بيانات الخطوط المتعددة
يوضّح هذا المثال طريقة لتصميم عناصر بيانات هندسة الخطوط المتعددة.
لمحة عن مجموعة البيانات
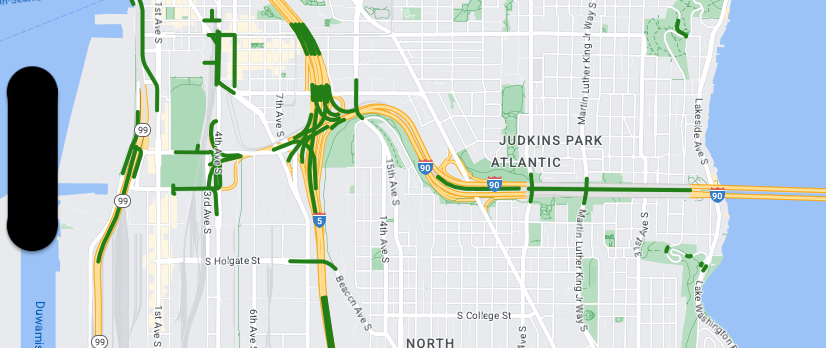
تعرض مجموعة البيانات المستخدَمة في هذا المثال جسورًا في منطقة سياتل. يعرض المقتطف التالي من ملف GeoJSON لمجموعة البيانات إدخالاً تمثيليًا للميزة.
{
  "type": "Feature",
  "properties": {
      "OBJECTID": 1,
      "COMPTYPE": 66,
      "COMPKEY": 515774,
      "HANSEGKEY": 489781,
      "UNITID": "BRG-935",
      "UNITTYPE": " ",
      "BRGUNITID": "BRG-935",
      "UNITDESC_BRG": "YALE AVE BR REV LANE OC                                                                                                                                                                                                                                        ",
      "UNITDESC_SEG": "HOWELL ST ON RP BETWEEN HOWELL ST AND I5 SB                                                                                                                                                                                                                    ",
      "INSTDATE": null,
      "EXPDATE": null,
      "STATUS": " ",
      "STATUSDT": null,
      "CONDITION": " ",
      "CONDDT": null,
      "OWN": " ",
      "LSTVERIFY": null,
      "MAINTBY": " ",
      "ADDBY": "GARCIAA",
      "ADDDTTM": "2010-01-21T00:00:00Z",
      "MODBY": null,
      "MODDTTM": null,
      "BR_NBR": 935,
      "BR_CODE": " 935",
      "BR_TYPE": "ST",
      "BR_NAME": "YALE AVE BR REV LANE OC",
      "BR_FACILITIES": "YALE AVE-SR 5 ON RAMP",
      "BR_FEATURES": "SR 5 REV LANE",
      "BR_RATING": 0,
      "BR_INSET": 1,
      "BR_GEO": "DT",
      "BR_OWNER": "DOT",
      "BR_OWNER_NAME": "State of Washington",
      "GEOBASID": 0,
      "XGEOBASID": 0,
      "GISSEGKEY": 489781,
      "EARTHQUAKE_RESPONSE_TEAM": " ",
      "SHAPE_Length": 220.11891836147655
  },
  "geometry": {
      "type": "LineString",
      "coordinates": [
          [
              -122.329201929090928,
              47.616910448708538
          ],
          [
              -122.329206483407461,
              47.616976719821004
          ],
          [
              -122.32921802149356,
              47.617042137515213
          ],
          [
              -122.329236413912909,
              47.617105967923777
          ],
          [
              -122.329261454336034,
              47.617167494985758
          ],
          [
              -122.329292861855023,
              47.617226028479571
          ],
          [
              -122.329330284134699,
              47.617280911766009
          ],
          [
              -122.329373301365223,
              47.617331529154569
          ],
          [
              -122.329421430971635,
              47.617377312810319
          ],
          [
              -122.329474133027375,
              47.617417749124023
          ],
          [
              -122.32953081631139,
              47.617452384473893
          ]
      ]
  }
},
تنسيق ميزات بيانات الخطوط المتعددة
تطبِّق المقتطفة التالية النمط نفسه مباشرةً على جميع ميزات البيانات.
Swift
// Define a style with green fill and stroke.
// Apply the style to the datasets features.
layer.style = { feature in
  let style = MutableFeatureStyle()
  style.fillColor = .green.withAlphaComponent(0.5);
  style.strokeColor = [UIColor greenColor];
  style.strokeWidth = 2.0;
  return style
}
Objective-C
// Define a style with green fill and stroke.
// Apply the style to the datasets features.
layer.style = ^(GMSDatasetFeature *feature) {
  GMSMutableFeatureStyle *style = [GMSMutableFeatureStyle style];
  style.fillColor = [[UIColor greenColor] colorWithAlphaComponent:0.5];
  style.strokeColor = [UIColor greenColor];
  style.strokeWidth = 2.0;
  return style;
};