تابع PLACES_COUNT_PER_H3 یک منطقه جغرافیایی برای جستجو می گیرد و جدولی از تعداد مکان ها در هر سلول H3 در منطقه جستجو را برمی گرداند.
از آنجا که تابع PLACES_COUNT_PER_GEO یک جدول را برمی گرداند، آن را با استفاده از یک عبارت FROM فراخوانی کنید.
پارامترهای ورودی:
مورد نیاز : پارامتر فیلتر
geographyکه ناحیه جستجو را مشخص می کند. پارامترgeographyمقداری است که توسط نوع داده BigQueryGEOGRAPHYتعریف شده است که از نقاط، رشته های خط و چند ضلعی ها پشتیبانی می کند.برای مثالهایی از استفاده از انواع مختلف جغرافیهای جستجو، مانند درگاههای دید و خطوط، به تابع
PLACES_COUNTمراجعه کنید.مورد نیاز : پارامتر فیلتر
h3_resolutionکه وضوح H3 مورد استفاده برای جمع آوری تعداد مکان ها در هر سلول H3 را مشخص می کند. مقدار پشتیبانی شده از 0 تا 8 است.اختیاری : پارامترهای فیلتر اضافی برای اصلاح جستجوی شما.
برمی گرداند:
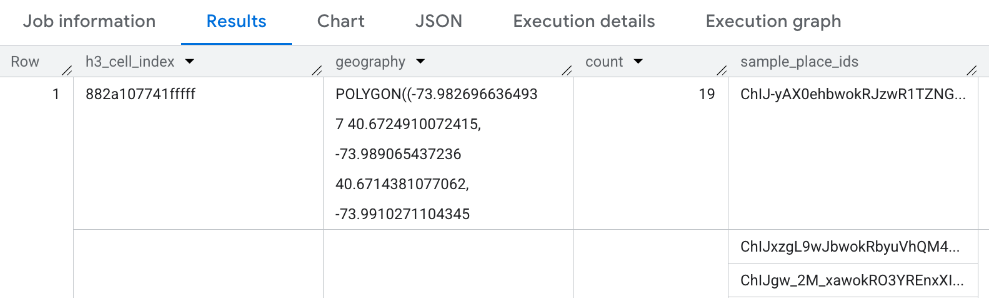
- جدولی با یک ردیف در هر سلول H3. این جدول شامل ستونهای
h3_cell_index(STRING)،geography(GEOGRAPHY) است که چند ضلعی نشاندهنده سلول H3،count(INT64) وplace_ids(ARRAY<STRING>) را تعریف میکند کهplace_idsحاوی حداکثر 250 شناسه مکان برای هر سلول H3 است.
- جدولی با یک ردیف در هر سلول H3. این جدول شامل ستونهای
مثال: به ازای هر سلول H3، فروشگاههای سهولت و خواربار در دسترس با ویلچر را بشمارید
مثال زیر تعداد فروشگاههای خواربار فروشی و سهولت در دسترس با ویلچر را در هر سلول H3 در شهر نیویورک محاسبه میکند. سلول های H3 از سطح وضوح 8 استفاده می کنند.
این مثال از مجموعه داده عمومی Overture Maps Data BigQuery برای بدست آوردن جغرافیای شهر نیویورک استفاده می کند.
DECLARE geo GEOGRAPHY;

-- Get the geography for New York City.
SET geo = (SELECT geometry FROM `bigquery-public-data.overture_maps.division_area`
  WHERE country = 'US' AND names.primary = 'City of New York'  LIMIT 1);

SELECT * FROM `PROJECT_NAME.places_insights___us.PLACES_COUNT_PER_H3`(
  JSON_OBJECT(
      'geography', geo,
      'types', ["convenience_store","grocery_store"],
      'wheelchair_accessible_entrance', true,
      'business_status', ['OPERATIONAL'],
      'h3_resolution', 8
    )
);
پاسخ برای تابع:
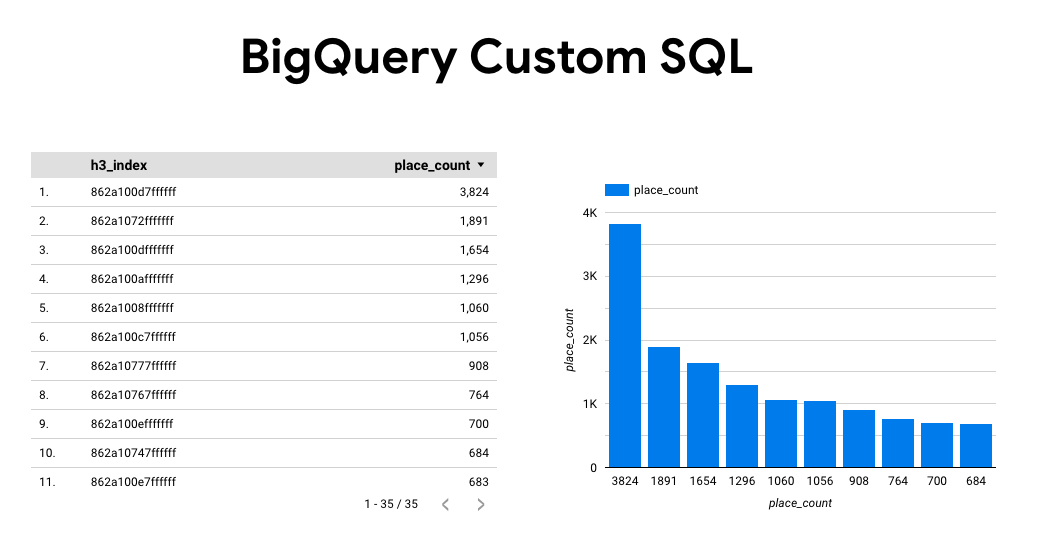
نتایج را تجسم کنید
تصاویر زیر این داده ها را در استودیو Looker به صورت یک نقشه پر شده نشان می دهد. هر چه سلول H3 تیره تر باشد، غلظت نتایج بیشتر می شود:

برای وارد کردن داده های خود به Looker Studio:
برای ایجاد نتایج تابع بالا را اجرا کنید.
در نتایج BigQuery، روی Open in -> Looker Studio کلیک کنید. نتایج شما به طور خودکار به Looker Studio وارد می شود.
Looker Studio یک صفحه گزارش پیشفرض ایجاد میکند و آن را با عنوان، جدول و نمودار میلهای از نتایج مقداردهی میکند.
همه موارد موجود در صفحه را انتخاب کرده و حذف کنید.
روی Insert -> Filled map کلیک کنید تا یک نقشه پر شده به گزارش شما اضافه شود.
در قسمت Chart Types -> Setup فیلدها را مطابق شکل زیر پیکربندی کنید:
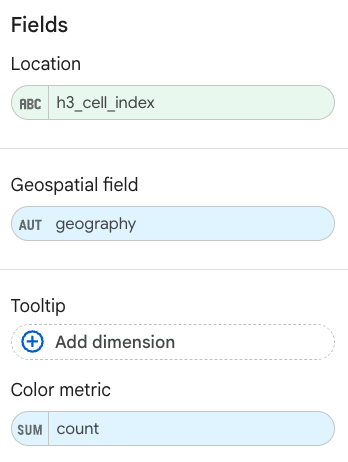
نقشه پر شده مانند بالا ظاهر می شود. برای پیکربندی بیشتر ظاهر نقشه، میتوانید به صورت اختیاری Chart Types -> Styles را انتخاب کنید.
برای اطلاعات بیشتر و مثال در مورد تجسم نتایج Places Insights، به مشاهده نتایج جستجو مراجعه کنید.