Codzienne i miesięczne zbiory danych PRISM to siatkowe zbiory danych klimatycznych
dla kontynentalnej części Stanów Zjednoczonych, opracowane przez
grupę PRISM Climate Group na Oregon State University.
Siatki są tworzone za pomocą modelu PRISM (Parameter-elevation Regressions on Independent Slopes Model). Algorytmy interpolacji PRISM symulują, jak pogoda i klimat zmieniają się wraz z wysokością nad poziomem morza, i uwzględniają efekty przybrzeżne, inwersje temperatury i bariery terenowe, które mogą powodować cień opadowy. Dane ze stacji są zbierane z wielu sieci w całym kraju. Więcej informacji znajdziesz w opisach przestrzennych zbiorów danych klimatycznych PRISM.
Uwaga
Ostrzeżenie: tego zbioru danych nie należy używać do obliczania trendów klimatycznych na przestrzeni stuleci ze względu na nieklimatyczne zmiany wynikające ze zmian wyposażenia i lokalizacji stacji, otwarcia i zamknięcia stacji, różnych godzin obserwacji oraz korzystania z sieci o stosunkowo krótkim okresie działania. Więcej informacji znajdziesz w dokumentacji zbioru danych.
Sieci obserwacyjne potrzebują czasu na przeprowadzenie kontroli jakości i udostępnienie danych ze stacji. Dlatego zestawy danych PRISM są ponownie modelowane kilka razy, aż do upływu 6 miesięcy, kiedy to są uznawane za trwałe. Dostępny jest harmonogram udostępniania.
Aby używać wersji tego zbioru danych o rozdzielczości 30 sekund łuku (~800 m), skontaktuj się z dostawcą pod adresem prism-questions@nacse.org.
Pasma
Rozmiar piksela 4638,3 m
Pasma
Nazwa
Jednostki
Minimum
Maks.
Rozmiar piksela
Opis
ppt
mm
0*
2639,82*
metry
Łączne miesięczne opady (w tym deszcz i stopiony śnieg)
tmean
°C
-30,8*
41,49*
metry
Średnia miesięczna średniej temperatury dziennej (obliczana jako (tmin+tmax)/2)
tmin
°C
-35,11*
34,72*
metry
Miesięczna temperatura minimalna
tmax
°C
-29,8*
49,74*
metry
Średnia miesięczna dzienna temperatura maksymalna
tdmean
°C
-30,7*
26,76*
metry
Średnia miesięczna dzienna średnia temperatura punktu rosy
vpdmin
hPa
0*
44,79*
metry
Średnia miesięczna minimalnego dziennego deficytu ciśnienia pary
vpdmax
hPa
0,009*
110,06*
metry
Średnia miesięczna maksymalnego dziennego deficytu ciśnienia pary
* szacowana wartość minimalna lub maksymalna
Właściwości obrazu
Właściwości obrazu
Nazwa
Typ
Opis
PRISM_CODE_VERSION
STRING_LIST
Lista wersji kodu dla każdego pasma, np. pierwszy element dotyczy pierwszego pasma „ppt”, drugi element dotyczy drugiego pasma „tmean”.
PRISM_DATASET_CREATE_DATE
STRING_LIST
Lista dat utworzenia poszczególnych pasm
PRISM_DATASET_FILENAME
STRING_LIST
Lista oryginalnych nazw plików dla każdego pasma
PRISM_DATASET_TYPE
STRING_LIST
Lista typów zbiorów danych według pasma
PRISM_DATASET_VERSION
STRING_LIST
Lista wersji zbiorów danych dla każdego pasma, np.D1 lub D2 w przypadku produktów dziennych; M1, M2 lub M3 w przypadku produktów miesięcznych.
status
CIĄG ZNAKÓW
Dane wygenerowane w ciągu 30 dni od obserwacji mają stan „wczesne”. Dane wygenerowane w okresie od 1 do 6 miesięcy od obserwacji mogą mieć stan „tymczasowe”, a dane starsze niż 6 miesięcy są oznaczone jako „stałe”.
Warunki korzystania z usługi
Te zbiory danych PRISM są dostępne bez ograniczeń
dotyczących użycia lub dystrybucji. PRISM Climate Group wymaga, aby użytkownik podał odpowiednie źródło i w stosownych przypadkach wskazał PRISM jako źródło danych.
[Daly, C., J.I. Smith i K.V. Olson. 2015. Mapowanie klimatu wilgotności atmosferycznej w kontynentalnej części Stanów Zjednoczonych. PloS
ONE 10(10):e0141140.
doi:10.1371/journal.pone.0141140.
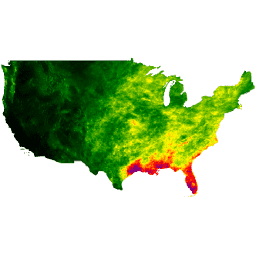
Dzienne i miesięczne zbiory danych PRISM to siatkowe zbiory danych klimatycznych dla kontynentalnej części Stanów Zjednoczonych, opracowane przez PRISM Climate Group na Oregon State University. Siatki są tworzone przy użyciu modelu PRISM (Parameter-elevation Regressions on Independent Slopes Model). Procedury interpolacji PRISM symulują, jak pogoda i klimat zmieniają się wraz z wysokością nad poziomem morza, i uwzględniają …
[null,null,[],[[["\u003cp\u003eThe PRISM AN81m dataset provides monthly gridded climate data for the conterminous United States from 1895 to 2024.\u003c/p\u003e\n"],["\u003cp\u003eIt includes precipitation, temperature, dew point temperature, and vapor pressure deficit data, calculated using the PRISM interpolation model.\u003c/p\u003e\n"],["\u003cp\u003eData is assimilated from various station networks, accounting for terrain and coastal effects on weather patterns.\u003c/p\u003e\n"],["\u003cp\u003eWhile freely available for use and distribution, the dataset is not suitable for century-long climate trend analysis due to inherent limitations.\u003c/p\u003e\n"],["\u003cp\u003eUsers are encouraged to attribute PRISM as the data source when utilizing this dataset.\u003c/p\u003e\n"]]],[],null,["# PRISM Monthly Spatial Climate Dataset AN81m\n\nDataset Availability\n: 1895-01-01T00:00:00Z--2025-07-01T00:00:00Z\n\nDataset Provider\n:\n\n\n [PRISM / OREGONSTATE](https://www.prism.oregonstate.edu/)\n\nCadence\n: 1 Month\n\nTags\n:\n[climate](/earth-engine/datasets/tags/climate) [geophysical](/earth-engine/datasets/tags/geophysical) [monthly](/earth-engine/datasets/tags/monthly) [oregonstate](/earth-engine/datasets/tags/oregonstate) [precipitation](/earth-engine/datasets/tags/precipitation) [pressure](/earth-engine/datasets/tags/pressure) [prism](/earth-engine/datasets/tags/prism) [temperature](/earth-engine/datasets/tags/temperature) [vapor](/earth-engine/datasets/tags/vapor) [weather](/earth-engine/datasets/tags/weather) \n\n#### Description\n\nThe PRISM daily and monthly datasets are gridded climate\ndatasets for the conterminous United States, produced by the\nPRISM Climate Group at Oregon State University.\n\nGrids are\ndeveloped using PRISM (Parameter-elevation Regressions on Independent\nSlopes Model). PRISM interpolation routines simulate how weather\nand climate vary with elevation, and account for coastal effects,\ntemperature inversions, and terrain barriers that can cause rain\nshadows. Station data are assimilated from many networks across\nthe country. For more information, see the [Descriptions of PRISM\nSpatial Climate Datasets](https://www.prism.oregonstate.edu/documents/PRISM_datasets.pdf).\n\n**Note**\n\n- **Warning** , this dataset should not be used to calculate century-long climate trends due to non-climatic variations from to station equipment and location changes, openings and closings, varying observation times, and the use of relatively short-term networks. Please see the [dataset\n documentation](https://www.prism.oregonstate.edu/documents/PRISM_datasets.pdf) for more details.\n- It takes time for observation networks to conduct quality control and release station data. Therefore, PRISM datasets are re-modeled several times until six months have elapsed, when they are considered permanent. A [release schedule is\n available](https://www.prism.oregonstate.edu/calendar/).\n- For use of the 30 arc-second (\\~800 m) version of this dataset please contact the provider at prism-questions@nacse.org.\n\n### Bands\n\n\n**Pixel Size**\n\n4638.3 meters\n\n**Bands**\n\n| Name | Units | Min | Max | Pixel Size | Description |\n|----------|-------|----------|-----------|------------|-------------------------------------------------------------------------|\n| `ppt` | mm | 0\\* | 2639.82\\* | meters | Monthly total precipitation (including rain and melted snow) |\n| `tmean` | °C | -30.8\\* | 41.49\\* | meters | Monthly average of daily mean temperature (calculated as (tmin+tmax)/2) |\n| `tmin` | °C | -35.11\\* | 34.72\\* | meters | Monthly minimum temperature |\n| `tmax` | °C | -29.8\\* | 49.74\\* | meters | Monthly average of daily maximum temperature |\n| `tdmean` | °C | -30.7\\* | 26.76\\* | meters | Monthly average of daily mean dew point temperature |\n| `vpdmin` | hPa | 0\\* | 44.79\\* | meters | Monthly average of daily minimum vapor pressure deficit |\n| `vpdmax` | hPa | 0.009\\* | 110.06\\* | meters | Monthly average of daily maximum vapor pressure deficit |\n\n\\* estimated min or max value\n\n### Image Properties\n\n**Image Properties**\n\n| Name | Type | Description |\n|---------------------------|-------------|-----------------------------------------------------------------------------------------------------------------------------------------------------------------------------------------------------------------|\n| PRISM_CODE_VERSION | STRING_LIST | List of code versions per-band, e.g: the first element is for the first band \"ppt\", the second element is for the second band \"tmean\" |\n| PRISM_DATASET_CREATE_DATE | STRING_LIST | List of original creation dates per-band |\n| PRISM_DATASET_FILENAME | STRING_LIST | List of original filenames for each band |\n| PRISM_DATASET_TYPE | STRING_LIST | List of dataset types per-band |\n| PRISM_DATASET_VERSION | STRING_LIST | List of dataset versions per-band e.g: D1 or D2 for daily products; M1, M2 or M3 for monthly products. |\n| status | STRING | Data generated within 30 days of observation have the status \"early\". Data generated within 1-6 months of observation may have the status \"provisional\" and data older than 6 months are marked as \"permanent\". |\n\n### Terms of Use\n\n**Terms of Use**\n\nThese PRISM datasets are available without restriction\non use or distribution. PRISM Climate Group does request that the\nuser give proper attribution and identify PRISM, where applicable,\nas the source of the data.\n\n### Citations\n\nCitations:\n\n- [Daly, C., Halbleib, M., Smith, J.I., Gibson, W.P., Doggett, M.K.,\n Taylor, G.H., Curtis, J., and Pasteris, P.A. 2008. Physiographically-sensitive\n mapping of temperature and precipitation across the conterminous\n United States. International Journal of Climatology, 28: 2031-2064](https://www.prism.oregonstate.edu/documents/pubs/2008intjclim_physiographicMapping_daly.pdf)\n- \\[Daly, C., J.I. Smith, and K.V. Olson. 2015. Mapping atmospheric\n moisture climatologies across the conterminous United States. PloS\n ONE 10(10):e0141140.\n [doi:10.1371/journal.pone.0141140](https://doi.org/10.1371/journal.pone.0141140).\n\n### DOIs\n\n- \u003chttps://doi.org/10.1371/journal.pone.0141140\u003e\n\n### Explore with Earth Engine\n\n| **Important:** Earth Engine is a platform for petabyte-scale scientific analysis and visualization of geospatial datasets, both for public benefit and for business and government users. Earth Engine is free to use for research, education, and nonprofit use. To get started, please [register for Earth Engine access.](https://console.cloud.google.com/earth-engine)\n\n### Code Editor (JavaScript)\n\n```javascript\nvar dataset = ee.ImageCollection('OREGONSTATE/PRISM/AN81m')\n .filter(ee.Filter.date('2018-07-01', '2018-07-31'));\nvar precipitation = dataset.select('ppt');\nvar precipitationVis = {\n min: 0.0,\n max: 300.0,\n palette: ['red', 'yellow', 'green', 'cyan', 'purple'],\n};\nMap.setCenter(-100.55, 40.71, 4);\nMap.addLayer(precipitation, precipitationVis, 'Precipitation');\n```\n[Open in Code Editor](https://code.earthengine.google.com/?scriptPath=Examples:Datasets/OREGONSTATE/OREGONSTATE_PRISM_AN81m) \n[PRISM Monthly Spatial Climate Dataset AN81m](/earth-engine/datasets/catalog/OREGONSTATE_PRISM_AN81m) \nThe PRISM daily and monthly datasets are gridded climate datasets for the conterminous United States, produced by the PRISM Climate Group at Oregon State University. Grids are developed using PRISM (Parameter-elevation Regressions on Independent Slopes Model). PRISM interpolation routines simulate how weather and climate vary with elevation, and account for ... \nOREGONSTATE/PRISM/AN81m, climate,geophysical,monthly,oregonstate,precipitation,pressure,prism,temperature,vapor,weather \n1895-01-01T00:00:00Z/2025-07-01T00:00:00Z \n24 -125 50 -66 \nGoogle Earth Engine \nhttps://developers.google.com/earth-engine/datasets\n\n- [https://doi.org/10.1371/journal.pone.0141140](https://doi.org/https://www.prism.oregonstate.edu/)\n- [https://doi.org/10.1371/journal.pone.0141140](https://doi.org/https://developers.google.com/earth-engine/datasets/catalog/OREGONSTATE_PRISM_AN81m)"]]