Page Summary
-
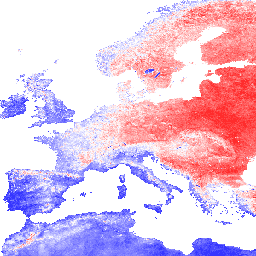
This dataset provides the standard deviation of long-term MODIS Land Surface Temperature (LST) for daytime and nighttime at 1 km resolution.
-
The data is based on time series from 2000 to 2017.
-
The dataset was derived using the data.table package and quantile function in R and excludes Antarctica.
-
It includes monthly standard deviation bands for each month of the year.
-
The dataset is available with a CC-BY-SA-4.0 license and can be cited using the provided DOI.
- Dataset Availability
- 2000-01-01T00:00:00Z–2018-01-01T00:00:00Z
- Dataset Producer
- EnvirometriX Ltd
- Tags
Description
Long-term MODIS LST day-time and night-time temperatures standard deviation at 1 km based on the 2000-2017 time series.
Derived using the data.table package and quantile function in R. For more info about the MODIS LST product see this page. Antarctica is not included.
To access and visualize maps outside of Earth Engine, use this page.
If you discover a bug, artifact or inconsistency in the LandGIS maps or if you have a question please use the following channels:
Bands
Bands
Pixel size: 1000 meters (all bands)
| Name | Units | Min | Max | Scale | Pixel Size | Description |
|---|---|---|---|---|---|---|
jan |
K | 25* | 390* | 0.02 | 1000 meters | Long-term Land Surface Temperature daytime monthly stddev, January |
feb |
K | 25* | 390* | 0.02 | 1000 meters | Long-term Land Surface Temperature daytime monthly stddev, February |
mar |
K | 25* | 390* | 0.02 | 1000 meters | Long-term Land Surface Temperature daytime monthly stddev, March |
apr |
K | 25* | 390* | 0.02 | 1000 meters | Long-term Land Surface Temperature daytime monthly stddev, April |
may |
K | 25* | 390* | 0.02 | 1000 meters | Long-term Land Surface Temperature daytime monthly stddev, May |
jun |
K | 25* | 390* | 0.02 | 1000 meters | Long-term Land Surface Temperature daytime monthly stddev, June |
jul |
K | 25* | 390* | 0.02 | 1000 meters | Long-term Land Surface Temperature daytime monthly stddev, July |
aug |
K | 25* | 390* | 0.02 | 1000 meters | Long-term Land Surface Temperature daytime monthly stddev, August |
sep |
K | 25* | 390* | 0.02 | 1000 meters | Long-term Land Surface Temperature daytime monthly stddev, September |
oct |
K | 25* | 390* | 0.02 | 1000 meters | Long-term Land Surface Temperature daytime monthly stddev, October |
nov |
K | 25* | 390* | 0.02 | 1000 meters | Long-term Land Surface Temperature daytime monthly stddev, November |
dec |
K | 25* | 390* | 0.02 | 1000 meters | Long-term Land Surface Temperature daytime monthly stddev, December |
Terms of Use
Terms of Use
Citations
Long-term MODIS LST day-time and night-time temperatures, sd and differences at 1 km based on the 2000-2017 time series 10.5281/zenodo.1420115
DOIs
Explore with Earth Engine
Code Editor (JavaScript)
var dataset = ee.Image('OpenLandMap/CLM/CLM_LST_MOD11A2-DAY_SD/v01');

var visualization = {
  bands: ['jan'],
  min: 25.0,
  max: 390.0,
  palette: [
    '2828ff','2828ff','6666ff','8989ff','a1a1ff','b2b2ff',
    'c0c0ff','cbcbff','d5d5ff','dedeff','e6e6ff','ededff',
    'f5f5ff','ffffff','fcfcff','fffbfb','fff4f4','ffeded',
    'ffe5e5','ffdddd','ffd4d4','ffcbcb','ffbfbf','ffb2b2',
    'ffa1a1','ff8a8a','ff6767','ff2929',
  ]
};

Map.centerObject(dataset);

Map.addLayer(dataset, visualization, 'Long-term Land Surface Temperature daytime monthly sd');