- Доступность набора данных
- 2010-01-01T00:00:00Z–2010-01-02T00:00:00Z
- Поставщик наборов данных
- Бюро переписи населения США
- Теги
- демографический
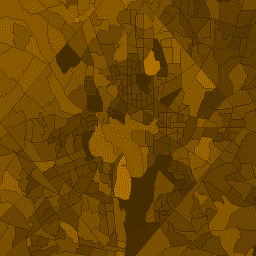
Описание
Бюро переписи населения США регулярно публикует геобазу данных TIGER. Эта таблица содержит значения демографического профиля 1 переписи 2010 года, агрегированные по переписным участкам. Площади участков сильно различаются, но в городских районах примерно соответствуют размерам кварталов. Существует около 74 000 полигональных объектов, охватывающих территорию США, округ Колумбия, Пуэрто-Рико и острова .
Полную техническую информацию о всех продуктах TIGER 2010 см. в технической документации TIGER .
Каждый участок также включает атрибуты с суммами измерений численности населения DP1, пересекающих границу. Столбцы имеют те же имена, что и столбец shortname в справочной таблице DP1 .
Схема таблицы
Схема таблицы
| Имя | Тип | Описание |
|---|---|---|
| аланд10 | ДВОЙНОЙ | Площадь земельного участка |
| awater10 | ДВОЙНОЙ | Акватория |
| геоид10 | НИТЬ | Идентификатор переписного тракта: объединение кода FIPS штата, кода FIPS округа и кода переписного тракта. |
| intptlat10 | НИТЬ | Широта внутренней точки |
| intptlon10 | НИТЬ | Долгота внутренней точки |
| namelsad10 | НИТЬ | Юридическое/статистическое описание территории и название переписного участка |
| shape_area | ДВОЙНОЙ | Площадь в квадратных градусах |
| shape_leng | ДВОЙНОЙ | Периметр в градусах |
Условия эксплуатации
Условия эксплуатации
Бюро переписи населения США предоставляет часть своих общедоступных данных в машиночитаемом формате через интерфейс прикладного программирования (API). Весь контент, документация, код и сопутствующие материалы, предоставляемые вам через API, регулируются настоящими условиями .
Цитаты
Для создания любых отчетов, публикаций, новых наборов данных, производных продуктов или услуг на основе набора данных пользователи должны ссылаться на Бюро переписи населения США .
Исследуйте с Earth Engine
Редактор кода (JavaScript)
var dataset = ee.FeatureCollection('TIGER/2010/Tracts_DP1');
var visParams = {
  min: 0,
  max: 4000,
  opacity: 0.8,
};

// Turn the strings into numbers
dataset = dataset.map(function (f) {
  return f.set('shape_area', ee.Number.parse(f.get('dp0010001')));
});

Map.setCenter(-103.882, 43.036, 8);
var image = ee.Image().float().paint(dataset, 'dp0010001');

Map.addLayer(image, visParams, 'TIGER/2010/Tracts_DP1');
Map.addLayer(dataset, null, 'for Inspector', false);
Визуализировать как FeatureView
FeatureView — это ускоренное представление FeatureCollection , доступное только для просмотра. Подробнее см. в документации FeatureView .
Редактор кода (JavaScript)
var fvLayer = ui.Map.FeatureViewLayer('TIGER/2010/Tracts_DP1_FeatureView');

var visParams = {
  opacity: 0.8,
  color: {
    property: 'dp0010001',
    mode: 'linear',
    palette: ['black', 'white'],
    min: 0,
    max: 4000
  }
};

fvLayer.setVisParams(visParams);
fvLayer.setName('US census tracts demographics');

Map.setCenter(-103.882, 43.036, 8);
Map.add(fvLayer);