- Proprietário do catálogo
- Catálogo da comunidade do GEE
- Disponibilidade de conjuntos de dados
- 2000-01-04T00:00:00Z–2025-11-18T00:00:00Z
- Provedor de conjunto de dados
- National Drought Mitigation Center
- Tags
Descrição
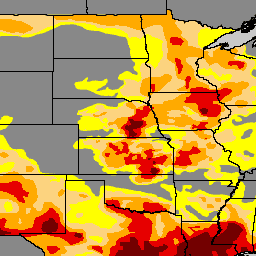
O U.S. Drought Monitor é um mapa divulgado todas as quintas-feiras que mostra as partes dos EUA que estão em seca. O mapa usa cinco classificações: anormalmente seco (D0), mostrando áreas que podem estar entrando ou saindo de uma seca, e quatro níveis de seca: moderada (D1), grave (D2), extrema (D3) e excepcional (D4). O Monitor de Seca é um esforço em equipe desde sua criação em 1999, produzido em conjunto pelo National Drought Mitigation Center (NDMC) da Universidade de Nebraska-Lincoln, pela National Oceanic and Atmospheric Administration (NOAA) e pelo Departamento de Agricultura dos EUA (USDA). O NDMC hospeda o site do monitor de seca e os dados associados, além de fornecer o mapa e os dados para a NOAA, o USDA e outras agências. Ele está disponível sem custo financeiro em droughtmonitor.unl.edu.
Bandas
Tamanho do pixel
250 metros
Bandas
| Nome | Mín. | Máx. | Tamanho do pixel | Descrição |
|---|---|---|---|---|
DM |
0 | 4 | metros | Classes de seca |
Termos de Uso
Termos de Uso
O trabalho está licenciado sob uma licença de dados abertos para uso. O U.S. Drought Monitor é produzido em conjunto pelo National Drought Mitigation Center da Universidade de Nebraska-Lincoln, pelo Departamento de Agricultura dos Estados Unidos e pela Administração Oceânica e Atmosférica Nacional. Mapa cortesia da NDMC.
Citações
National Drought Mitigation Center; U.S. Department of Agriculture; National Oceanic and Atmospheric Administration (2023). United States Drought Monitor. Universidade de Nebraska-Lincoln. https://droughtmonitor.unl.edu/. Acessado em 17/09/2023
Descobrir com o Earth Engine
Editor de código (JavaScript)
var usdm = ee.ImageCollection(
  "projects/sat-io/open-datasets/us-drought-monitor"
);
/*
Category	Description
DO	Abnormally Dry
D1	Moderate Drought
D2	Severe Drought
D3	Extreme Drought
D4	Exceptional Drought
*/

var usdm = ee.Image(usdm.toList(usdm.size()).get(-1));

// Define a dictionary which will be used to make legend and visualize image on map
var dict = {
  names: [
    "DO	Abnormally Dry", //1
    "D1 Moderate Drought", //2
    "D2 Severe Drought", //3
    "D3 Extreme Drought", //4
    "D4 Exceptional Drought", //5
  ],
  colors: ["FFFF00", "FCD37F", "FFAA00", "E60000", "730000"],
};

// Create a panel to hold the legend widget
var legend = ui.Panel({
  style: {
    position: "bottom-left",
    padding: "8px 15px",
  },
});

// Function to generate the legend
function addCategoricalLegend(panel, dict, title) {
  // Create and add the legend title.
  var legendTitle = ui.Label({
    value: title,
    style: {
      fontWeight: "bold",
      fontSize: "18px",
      margin: "0 0 4px 0",
      padding: "0",
    },
  });
  panel.add(legendTitle);

  var loading = ui.Label("Loading legend...", { margin: "2px 0 4px 0" });
  panel.add(loading);

  // Creates and styles 1 row of the legend.
  var makeRow = function (color, name) {
    // Create the label that is actually the colored box.
    var colorBox = ui.Label({
      style: {
        backgroundColor: color,
        // Use padding to give the box height and width.
        padding: "8px",
        margin: "0 0 4px 0",
      },
    });

    // Create the label filled with the description text.
    var description = ui.Label({
      value: name,
      style: { margin: "0 0 4px 6px" },
    });

    return ui.Panel({
      widgets: [colorBox, description],
      layout: ui.Panel.Layout.Flow("horizontal"),
    });
  };

  // Get the list of palette colors and class names from the image.
  var palette = dict["colors"];
  var names = dict["names"];
  loading.style().set("shown", false);

  for (var i = 0; i < names.length; i++) {
    panel.add(makeRow(palette[i], names[i]));
  }

  Map.add(panel);
}

/*
  // Display map and legend ///////////////////////////////////////////////////////////////////////////////
*/

// Add the legend to the map
addCategoricalLegend(legend, dict, "US Drought Monitor");

// Add USDM Image image to the map
Map.addLayer(
  usdm,
  { min: 0, max: 4, palette: dict["colors"] },
  usdm.get("system:index").getInfo()
);