PLACES_COUNT_PER_GEO 함수는 검색할 지리적 영역의 배열을 가져와 영역별 장소 수의 표를 반환합니다. 예를 들어 우편번호 배열을 검색 영역으로 지정하면 응답에 각 우편번호의 별도 행이 있는 표가 포함됩니다.
PLACES_COUNT_PER_GEO 함수는 테이블을 반환하므로 FROM 절을 사용하여 호출합니다.
입력 매개변수:
반환:
- 지리적 영역당 하나의 행이 있는 테이블 이 테이블에는
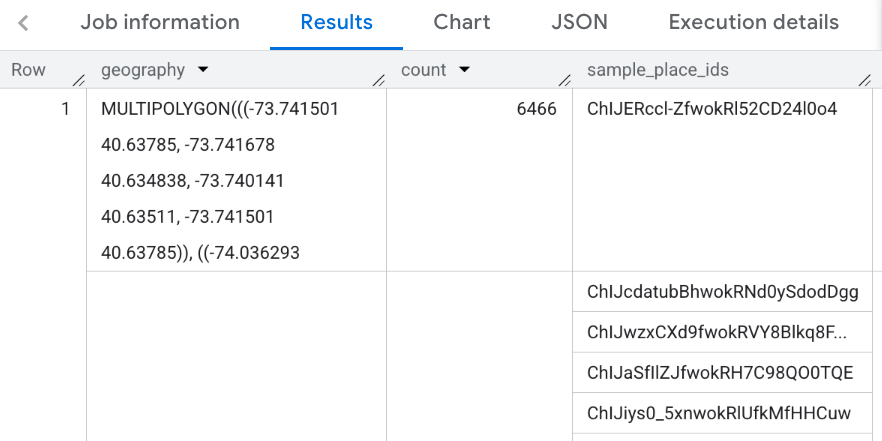
geography(GEOGRAPHY),count(INT64),place_ids(ARRAY<STRING>) 열이 포함되어 있습니다. 여기서place_ids에는 각 지리적 영역의 장소 ID가 최대 250개 포함됩니다.
- 지리적 영역당 하나의 행이 있는 테이블 이 테이블에는
예: 뉴욕시 각 카운티의 레스토랑 수 계산
이 예에서는 뉴욕시의 카운티별로 운영 중인 레스토랑의 개수를 나타내는 표를 생성합니다.
이 예에서는 미국 인구조사국 데이터 BigQuery 공개 데이터 세트를 사용하여 뉴욕시의 세 카운티('퀸스','킹스', '뉴욕')의 경계를 가져옵니다. 각 카운티의 경계는 county_geom 열에 포함됩니다.
그런 다음 이 예에서는 BigQuery ST_SIMPLIFY 함수를 사용하여 county_geom의 단순화된 버전을 반환합니다. ST_SIMPLIFY 함수는 거의 직선에 가까운 모서리 체인을 단일 긴 모서리로 대체합니다.
DECLARE geos ARRAY<GEOGRAPHY>;

SET geos = (SELECT ARRAY_AGG(ST_SIMPLIFY(county_geom, 100))
            FROM `bigquery-public-data.geo_us_boundaries.counties`
            WHERE county_name IN ("Queens","Kings", "New York") AND state_fips_code = "36");

SELECT * FROM `PROJECT_NAME.places_insights___us.PLACES_COUNT_PER_GEO`(
  JSON_OBJECT(
      'geographies', geos,
      'types', ["restaurant"],
      'business_status', ["OPERATIONAL"]
      )
);
함수의 응답은 다음과 같습니다.
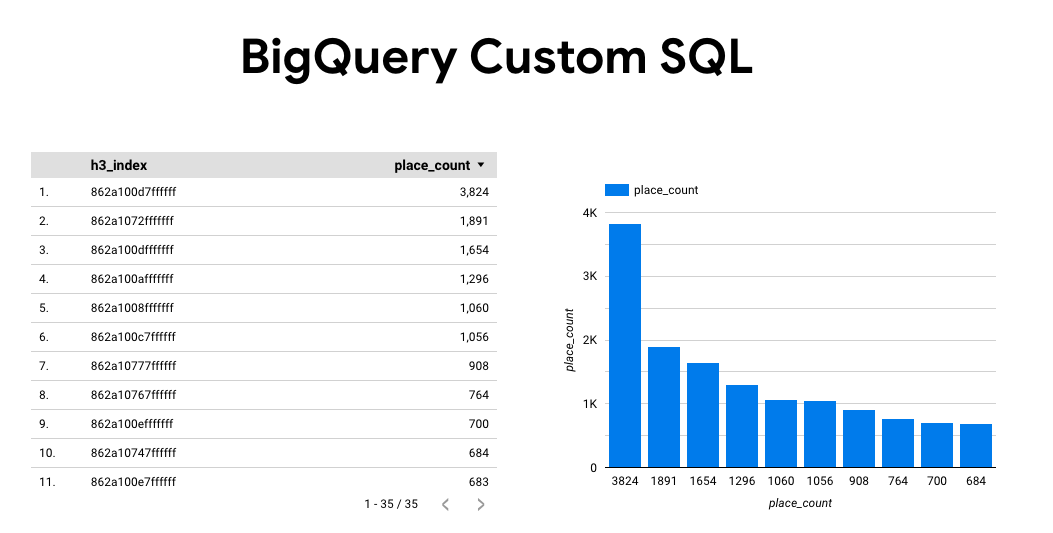
결과 시각화
다음 이미지는 각 카운티의 윤곽선을 포함하여 Looker Studio에 채워진 지도로 표시된 이 데이터를 보여줍니다.

Looker Studio로 데이터를 가져오려면 다음 단계를 따르세요.
위 함수를 실행하여 결과를 생성합니다.
BigQuery 결과에서 다음에서 열기 -> Looker Studio를 클릭합니다. 결과가 Looker Studio로 자동 가져오기됩니다.
Looker Studio에서 기본 보고서 페이지를 만들고 결과의 제목, 표, 막대 그래프로 초기화합니다.
페이지의 모든 항목을 선택하고 삭제합니다.
삽입 -> 색상 지도를 클릭하여 보고서에 색상 지도를 추가합니다.
차트 유형 -> 설정에서 아래와 같이 필드를 구성합니다.
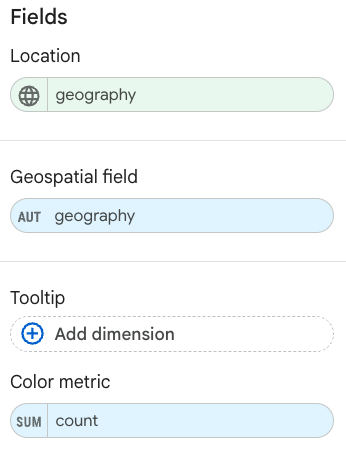
채워진 지도는 위와 같이 표시됩니다. 원하는 경우 차트 유형 -> 스타일을 선택하여 지도의 모양을 추가로 구성할 수 있습니다.
장소 통계 결과를 시각화하는 방법에 관한 자세한 내용과 예는 쿼리 결과 시각화를 참고하세요.