PLACES_COUNT_PER_H3 함수는 검색할 지리적 영역을 가져와 검색 영역의 H3 셀별 장소 수 테이블을 반환합니다.
PLACES_COUNT_PER_GEO 함수는 테이블을 반환하므로 FROM 절을 사용하여 호출합니다.
입력 매개변수:
반환:
- H3 셀당 하나의 행이 있는 테이블 이 테이블에는 H3 셀을 나타내는 다각형을 정의하는
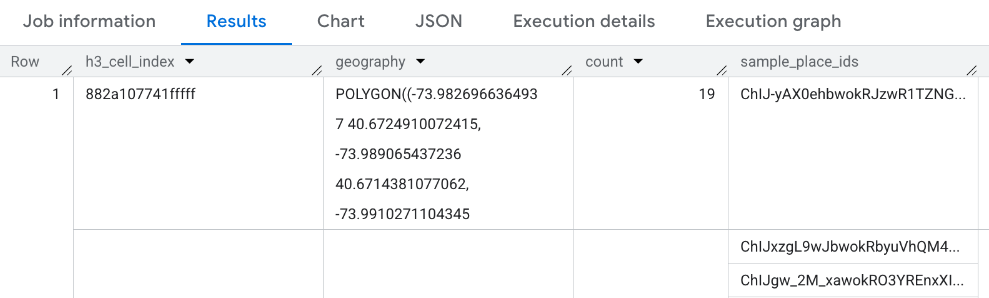
h3_cell_index(STRING),geography(GEOGRAPHY),count(INT64),place_ids(ARRAY<STRING>) 열이 포함되어 있으며, 여기서place_ids에는 각 H3 셀의 장소 ID가 최대 250개 포함됩니다.
- H3 셀당 하나의 행이 있는 테이블 이 테이블에는 H3 셀을 나타내는 다각형을 정의하는
예: H3 셀당 휠체어 이용 가능 편의점 및 식료품점 수 계산
아래 예에서는 뉴욕시의 H3 셀당 운영 중인 휠체어 이용 가능 편의점 및 식료품점 수를 계산합니다. H3 셀은 해상도 수준 8을 사용합니다.
이 예에서는 Overture Maps 데이터 BigQuery 공개 데이터 세트를 사용하여 뉴욕시의 지리를 가져옵니다.
DECLARE geo GEOGRAPHY;

-- Get the geography for New York City.
SET geo = (SELECT geometry FROM `bigquery-public-data.overture_maps.division_area`
  WHERE country = 'US' AND names.primary = 'City of New York'  LIMIT 1);

SELECT * FROM `PROJECT_NAME.places_insights___us.PLACES_COUNT_PER_H3`(
  JSON_OBJECT(
      'geography', geo,
      'types', ["convenience_store","grocery_store"],
      'wheelchair_accessible_entrance', true,
      'business_status', ['OPERATIONAL'],
      'h3_resolution', 8
    )
);
함수의 응답은 다음과 같습니다.
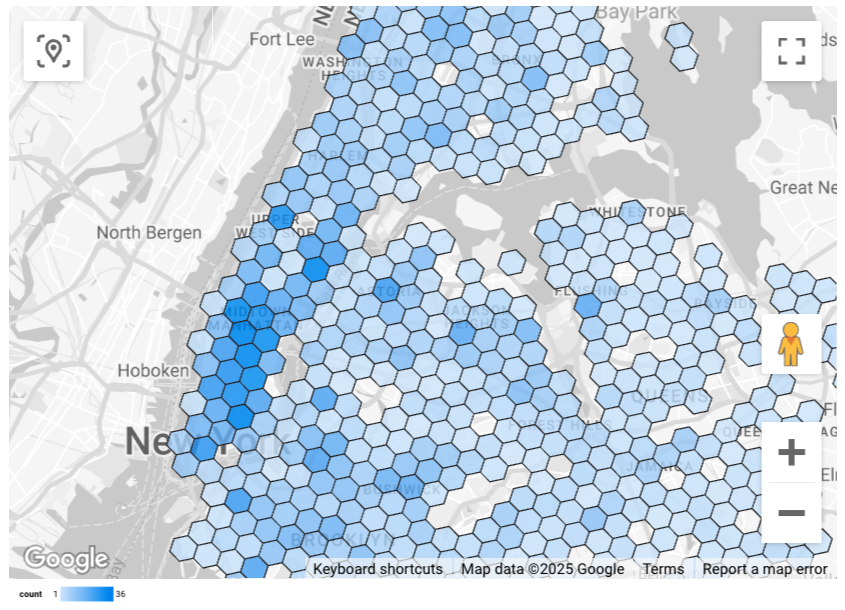
결과 시각화
다음 이미지는 Looker Studio에서 이 데이터를 색상으로 채워진 지도에 표시한 것입니다. H3 셀이 어두울수록 결과의 집중도가 높습니다.
Looker Studio로 데이터를 가져오려면 다음 단계를 따르세요.
위 함수를 실행하여 결과를 생성합니다.
BigQuery 결과에서 다음에서 열기 -> Looker Studio를 클릭합니다. 결과가 Looker Studio로 자동 가져오기됩니다.
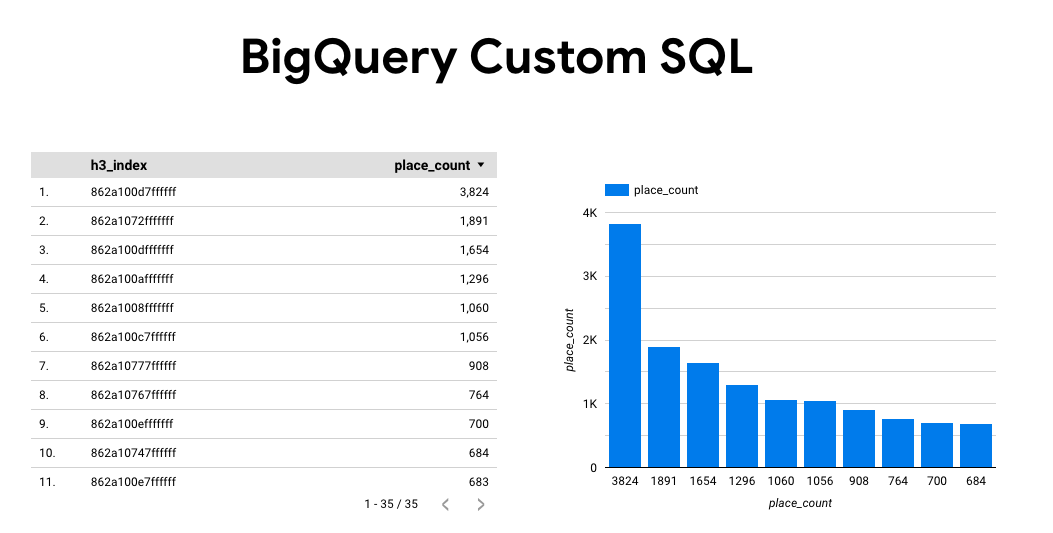
Looker Studio에서 기본 보고서 페이지를 만들고 결과의 제목, 표, 막대 그래프로 초기화합니다.
페이지의 모든 항목을 선택하고 삭제합니다.
삽입 -> 색상 지도를 클릭하여 보고서에 색상 지도를 추가합니다.
차트 유형 -> 설정에서 아래와 같이 필드를 구성합니다.
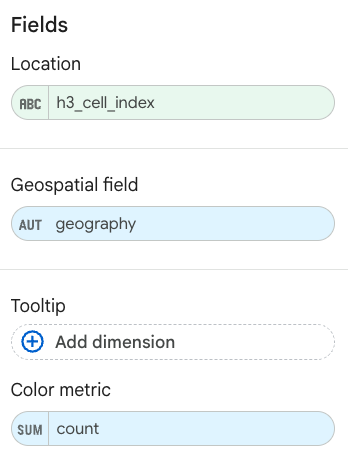
채워진 지도는 위와 같이 표시됩니다. 원하는 경우 차트 유형 -> 스타일을 선택하여 지도의 모양을 추가로 구성할 수 있습니다.
장소 통계 결과를 시각화하는 방법에 관한 자세한 내용과 예는 쿼리 결과 시각화를 참고하세요.