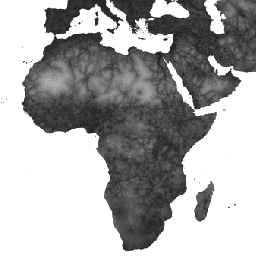
Ta mapa globalnej dostępności przedstawia czas dojazdu lądowego (w minutach) do najbliższego szpitala lub kliniki we wszystkich obszarach między 85 stopniem szerokości geograficznej północnej a 60 stopniem szerokości geograficznej południowej w nominalnym roku 2019. Obejmuje też czas podróży „pieszej”, w której wykorzystywane są wyłącznie niemotorowe środki transportu.
Dzięki dużym wysiłkom w zakresie zbierania danych podejmowanym przez OpenStreetMap, Mapy Google i badaczy akademickich udało się zebrać najbardziej kompletną kolekcję lokalizacji placówek opieki zdrowotnej. Ta mapa powstała w wyniku współpracy MAP (University of Oxford), Telethon Kids Institute (Perth, Australia), Google i University of Twente (Holandia).
Projekt ten opiera się na wcześniejszych pracach opublikowanych przez Weissa i in. w 2018 r. (doi:10.1038/nature25181).
Weiss i współautorzy (2018 r.) wykorzystali zbiory danych dotyczące dróg (obejmujące pierwsze w historii użycie na skalę globalną zbiorów danych Open Street Map i Google Roads), kolei, rzek, jezior, oceanów, warunków topograficznych (nachylenia i wysokości), rodzajów pokrycia terenu i granic państw. Każdemu z tych zbiorów danych przypisano prędkość lub prędkości podróży w postaci czasu potrzebnego na pokonanie każdego piksela danego typu. Zestawy danych zostały następnie połączone, aby utworzyć „powierzchnię tarcia”, czyli mapę, na której każdy piksel ma przypisaną nominalną ogólną prędkość podróży na podstawie typów występujących w tym pikselu. W przypadku bieżącego projektu utworzono zaktualizowaną powierzchnię o wysokim współczynniku tarcia, aby uwzględnić najnowsze ulepszenia w danych o drogach w OSM.
Algorytmy najkrótszej ścieżki (uruchamiane w Google Earth Engine, a w przypadku obszarów o wysokiej szerokości geograficznej – w R) zostały użyte w połączeniu z tą powierzchnią tarcia do obliczenia czasu podróży ze wszystkich lokalizacji do najbliższego (w czasie) ośrodka opieki zdrowotnej. Zbiór danych o placówkach opieki zdrowotnej wykorzystuje dane o lokalizacji z 2 największych globalnych baz danych: (1) dane OSM, które zostały zebrane i udostępnione do pobrania na stronie www.healthsites.io; oraz (2) dane wyodrębnione z Map Google. Globalne zbiory danych zostały uzupełnione o lokalizacje obiektów na skalę kontynentalną, które zostały niedawno opublikowane w przypadku Afryki i Australii. Aby ułatwić porównywanie źródeł danych, użyto tylko placówek zdefiniowanych jako szpitale i kliniki. Wiele punktów znalezionych w tym samym pikselu zostało połączonych, aby dopasować je do rozdzielczości analizy określonej przez wybraną siatkę reprezentującą powierzchnię Ziemi. Każdy piksel na mapie dostępności przedstawia najkrótszy czas (w minutach) potrzebny na dotarcie z danego miejsca do szpitala lub kliniki.
Kredyty za zbiór danych źródłowych są opisane w odpowiednim dokumencie.
Pasma
Rozmiar piksela 927,67 m
Pasma
Nazwa
Jednostki
Minimum
Maks.
Rozmiar piksela
Opis
accessibility
min
0
41504.1
metry
Czas dojazdu do najbliższego szpitala lub przychodni.
accessibility_walking_only
min
0
138893
metry
Czas dojazdu do najbliższego szpitala lub przychodni środkiem transportu niemotorowego.
D.J. Weiss, A. Nelson, C.A. Vargas-Ruiz, K. Gligorić, S. Bavadekar,
E. Gabrilovich, A. Bertozzi-Villa, J. Rozier, H.S. Gibson, T. Shekel,
C. Kamath, A. Lieber, K. Schulman, Y. Shao, V. Qarkaxhija, A.K. Nandi,
S.H. Keddie, S. Rumisha, E. Cameron, K.E. Battle, S. Bhatt, P.W. Gething.
Globalne mapy czasu dojazdu do placówek opieki zdrowotnej. Nature Medicine (2020).
Ta globalna mapa dostępności przedstawia czas dojazdu drogą lądową (w minutach) do najbliższego szpitala lub kliniki we wszystkich obszarach między 85 stopniem szerokości geograficznej północnej a 60 stopniem szerokości geograficznej południowej w nominalnym roku 2019. Obejmuje on również czas podróży „pieszej”, w której wykorzystywane są wyłącznie niemotorowe środki transportu. Trwają intensywne działania związane ze zbieraniem danych prowadzone przez …
[null,null,[],[[["\u003cp\u003eThis dataset provides a global map of travel time to the nearest hospital or clinic, including both overall and walking-only travel times.\u003c/p\u003e\n"],["\u003cp\u003eThe data covers areas between 85 degrees north and 60 degrees south for the year 2019, with a resolution of 927.67 meters.\u003c/p\u003e\n"],["\u003cp\u003eThe map was created using a friction surface model and least-cost-path algorithms, incorporating data from OpenStreetMap, Google Maps, and other sources.\u003c/p\u003e\n"],["\u003cp\u003eHealthcare facility locations were sourced from healthsites.io, Google Maps, and other continental-scale datasets, focusing on hospitals and clinics.\u003c/p\u003e\n"],["\u003cp\u003eThis dataset is licensed under a Creative Commons Attribution 4.0 International License.\u003c/p\u003e\n"]]],[],null,["# Accessibility to Healthcare 2019\n\nDataset Availability\n: 2019-01-01T00:00:00Z--2020-01-01T00:00:00Z\n\nDataset Provider\n:\n\n\n [Malaria Atlas Project](https://malariaatlas.org/research-project/accessibility-to-cities/)\n\nTags\n:\n[accessibility](/earth-engine/datasets/tags/accessibility) [jrc](/earth-engine/datasets/tags/jrc) [map](/earth-engine/datasets/tags/map) [oxford](/earth-engine/datasets/tags/oxford) [population](/earth-engine/datasets/tags/population) [twente](/earth-engine/datasets/tags/twente) \n\n#### Description\n\nThis global accessibility map enumerates land-based travel time (in\nminutes) to the nearest hospital or clinic for all areas between 85\ndegrees north and 60 degrees south for a nominal year 2019. It also\nincludes \"walking-only\" travel time, using non-motorized means of\ntransportation only.\n\nMajor data collection efforts underway by OpenStreetMap, Google Maps, and\nacademic researchers have been harnessed to compile the most complete\ncollection of healthcare facility locations to date. This map was\nproduced through a collaboration between MAP (University of Oxford),\nTelethon Kids Institute (Perth, Australia), Google, and the University\nof Twente, Netherlands.\n\nThis project builds on previous work published by Weiss et al 2018\n([doi:10.1038/nature25181](https://doi.org/10.1038/nature25181)).\nWeiss et al (2018) utilised datasets for roads\n(comprising the first ever global-scale use of Open Street Map and Google\nroads datasets), railways, rivers, lakes, oceans, topographic conditions\n(slope and elevation), landcover types, and national borders. These\ndatasets were each allocated a speed or speeds of travel in terms of time\nto cross each pixel of that type. The datasets were then combined to\nproduce a \"friction surface\": a map where every pixel is allocated a\nnominal overall speed of travel based on the types occurring within that\npixel. For the current project, an updated friction surface was created to\nincorporate recent improvements within OSM roads data.\n\nLeast-cost-path algorithms (run in Google Earth Engine and, for\nhigh-latitude areas, in R) were used in conjunction with this friction\nsurface to calculate the time of travel from all locations to the nearest\n(in time) healthcare facility. The healthcare facilities dataset utilized\nlocation data from two of the largest global databases: (1) OSM data that\nwas collated and made available for download at\n[www.healthsites.io](https://www.healthsites.io/); and (2) data\nextracted from Google Maps. The global datasets were augmented with\ncontinental-scale facility locations that were recently published for\nAfrica and Australia. To facilitate comparisons between data sources, only\nfacilities defined as hospitals and clinics were used. Multiple points\nfound within the same pixel were merged to match the resolution of the\nanalysis as defined by the selected gridded representation of the Earth's\nsurface. Each pixel in the resultant accessibility map thus represents the\nmodelled shortest time (in minutes) from that location to a hospital or\nclinic.\n\nSource dataset credits are as described in the accompanying paper.\n\n### Bands\n\n\n**Pixel Size**\n\n927.67 meters\n\n**Bands**\n\n| Name | Units | Min | Max | Pixel Size | Description |\n|------------------------------|-------|-----|---------|------------|------------------------------------------------------------------------------|\n| `accessibility` | min | 0 | 41504.1 | meters | Travel time to the nearest hospital or clinic. |\n| `accessibility_walking_only` | min | 0 | 138893 | meters | Travel time to the nearest hospital or clinic using non-motorized transport. |\n\n### Terms of Use\n\n**Terms of Use**\n\nThis work is licensed under a [Creative Commons Attribution\n4.0 International License](https://creativecommons.org/licenses/by/4.0/).\n\n### Citations\n\nCitations:\n\n- D.J. Weiss, A. Nelson, C.A. Vargas-Ruiz, K. Gligorić, S. Bavadekar,\n E. Gabrilovich, A. Bertozzi-Villa, J. Rozier, H.S. Gibson, T. Shekel,\n C. Kamath, A. Lieber, K. Schulman, Y. Shao, V. Qarkaxhija, A.K. Nandi,\n S.H. Keddie, S. Rumisha, E. Cameron, K.E. Battle, S. Bhatt, P.W. Gething.\n Global maps of travel time to healthcare facilities. Nature Medicine (2020).\n\n### Explore with Earth Engine\n\n| **Important:** Earth Engine is a platform for petabyte-scale scientific analysis and visualization of geospatial datasets, both for public benefit and for business and government users. Earth Engine is free to use for research, education, and nonprofit use. To get started, please [register for Earth Engine access.](https://console.cloud.google.com/earth-engine)\n\n### Code Editor (JavaScript)\n\n```javascript\nvar dataset = ee.Image('Oxford/MAP/accessibility_to_healthcare_2019');\nvar accessibility = dataset.select('accessibility');\nvar accessibilityVis = {\n min: 0.0,\n max: 41556.0,\n gamma: 4.0,\n};\nMap.setCenter(18.98, 6.66, 2);\nMap.addLayer(accessibility, accessibilityVis, 'Accessibility');\n```\n[Open in Code Editor](https://code.earthengine.google.com/?scriptPath=Examples:Datasets/Oxford/Oxford_MAP_accessibility_to_healthcare_2019) \n[Accessibility to Healthcare 2019](/earth-engine/datasets/catalog/Oxford_MAP_accessibility_to_healthcare_2019) \nThis global accessibility map enumerates land-based travel time (in minutes) to the nearest hospital or clinic for all areas between 85 degrees north and 60 degrees south for a nominal year 2019. It also includes \"walking-only\" travel time, using non-motorized means of transportation only. Major data collection efforts underway by ... \nOxford/MAP/accessibility_to_healthcare_2019, accessibility,jrc,map,oxford,population,twente \n2019-01-01T00:00:00Z/2020-01-01T00:00:00Z \n-60 -180 85 180 \nGoogle Earth Engine \nhttps://developers.google.com/earth-engine/datasets\n\n- [](https://doi.org/https://malariaatlas.org/research-project/accessibility-to-cities/)\n- [](https://doi.org/https://developers.google.com/earth-engine/datasets/catalog/Oxford_MAP_accessibility_to_healthcare_2019)"]]