-
GHSL: 도시화 정도 1975~2030 V2-0 (P2023A)

이 래스터 데이터 세트는 GHSL 프로젝트에서 5년 간격으로 1975~2030년의 시대를 대상으로 생성한 전역 그리드 인구 및 건물 표면 데이터를 기반으로 UN 통계 위원회에서 권장하는 '도시화 정도' 1단계 방법론을 적용하여 전역 다중 시간 농촌-도시 분류를 나타냅니다. 정도… ghsl jrc population sdg settlement -
GHSL: 전역 건물 높이 2018 (P2023A)
이 공간 래스터 데이터 세트는 2018년을 기준으로 100m 해상도의 건물 높이의 전역 분포를 보여줍니다. 건물 높이를 예측하는 데 사용되는 입력 데이터는 ALOS 전역 디지털 표면 모델 (30m), NASA 셔틀 레이더 지형 미션… alos building built built-environment builtup copernicus -
GHSL: 전역 건물 부피 1975~2030 (P2023A)
이 래스터 데이터 세트는 100m 그리드 셀당 세제곱미터로 표현된 건물 부피의 전역 분포를 보여줍니다. 이 데이터 세트는 총 건물 부피와 주로 비주거용 (NRES)으로 사용되는 그리드 셀에 할당된 건물 부피를 측정합니다. 추정치는 건물… alos building built-environment copernicus dem ghsl -
GHSL: 전역 건물 표면 10m (P2023A)
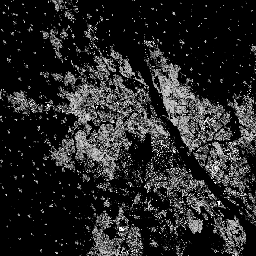
이 래스터 데이터 세트는 S2 이미지 데이터에서 관찰된 2018년의 건물 표면 분포를 10m 그리드 셀당 제곱미터로 표현하여 보여줍니다. 데이터 세트는 다음을 측정합니다. a) 총 건물 표면, b) 그리드 셀에 할당된 건물 표면… built built-environment builtup copernicus ghsl jrc -
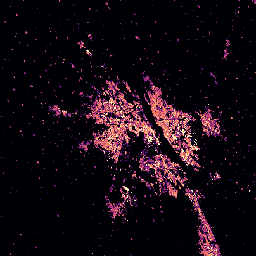
GHSL: 전역 건물 표면 1975~2030 (P2023A)
이 래스터 데이터 세트는 건물 표면 분포를 100m 그리드 셀당 제곱미터로 표현하여 보여줍니다. 데이터 세트는 다음을 측정합니다. a) 총 건물 표면, b) 주로 비주거용 (NRES)으로 사용되는 그리드 셀에 할당된 건물 표면… 데이터는 공간-시간적으로 보간되거나… built built-environment builtup copernicus ghsl jrc -
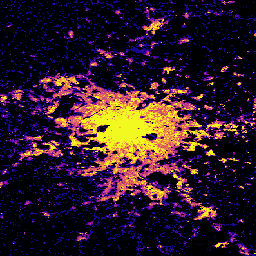
GHSL: 전역 인구 표면 1975~2030 (P2023A)

이 래스터 데이터 세트는 주거 인구의 공간 분포를 셀의 절대 거주자 수로 표현하여 보여줍니다. CIESIN GPWv4.11에서 파생된 5년 간격의 1975~2020년 주거 인구 추정치와 2025년 및 2030년 예측치는 인구조사 또는… ghsl jrc population sdg -
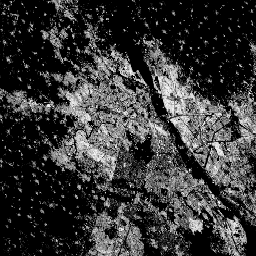
GHSL: 전역 정착지 특성 (10m) 2018 (P2023A)
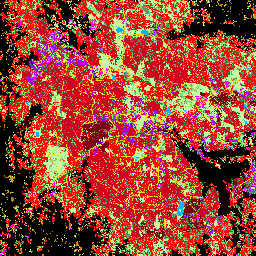
이 공간 래스터 데이터 세트는 10m 해상도로 인간 정착지를 나타내고 건물 환경의 기능 및 높이 관련 구성요소 측면에서 내부 특성을 설명합니다. GHSL 데이터 제품에 관한 자세한 내용은 GHSL 데이터 패키지 2023 보고서… building built builtup copernicus ghsl height
Datasets tagged sdg in Earth Engine
[null,null,[],[],[]]