本页面除了介绍如何以程序化方式访问数据集并设置其地图项的样式,还通过示例演示了如何基于点、多边形和多段线几何图形设置数据地图项的样式。
在对数据集进行数据驱动型样式设置时,系统会基于创建数据集时所用的地理空间数据文件中提供的经纬度坐标来渲染数据地图项。
点数据的样式设置示例
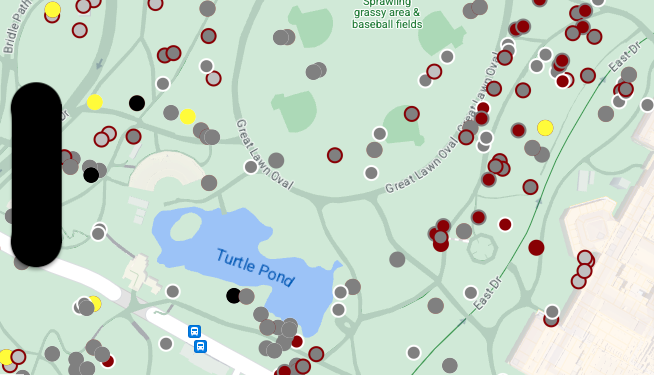
本例演示了如何为基于点几何图形的数据地图项设置样式。

关于数据集
本例中使用的数据集是纽约市中央公园 2018 年松鼠调查的结果。下表摘录自 CSV 格式的调查数据文件,从中我们可以看到:x 和 y 列用于表示地理位置;表中包含 LatLng 列,但在本例中并未使用该列,因为如果列名为 WKT,数据集仅支持 WKT 格式。如需详细了解位置信息支持的格式,请参阅 CSV 要求。
松鼠普查数据集包含多种不同的数据点,这些数据点与观察到的松鼠毛色和行为相关(请务必水平滚动屏幕,以查看全部内容)。
| X | Y | UniqueSquirrelID | Hectare | Shift | Date | Hectare SquirrelNumber | Age | PrimaryFurColor | HighlightFurColor | CombinationofPrimaryandHighlightColor | Colornotes | Location | AboveGroundSighter Measurement | SpecificLocation | Running | Chasing | Climbing | Eating | Foraging | Other Activities | Kuks | Quaas | Moans | Tailflags | Tailtwitches | Approaches | Indifferent | Runsfrom | OtherInteractions | LatLng |
|---|---|---|---|---|---|---|---|---|---|---|---|---|---|---|---|---|---|---|---|---|---|---|---|---|---|---|---|---|---|---|
| -73.9561344937861 | 40.7940823884086 | 37F-PM-1014-03 | 37F | PM | 10142018 | 3 | + | false | false | false | false | false | false | false | false | false | false | false | false | false | POINT (-73.9561344937861 40.7940823884086) | |||||||||
| -73.9688574691102 | 40.7837825208444 | 21B-AM-1019-04 | 21B | AM | 10192018 | 4 | + | false | false | false | false | false | false | false | false | false | false | false | false | false | POINT (-73.9688574691102 40.7837825208444) | |||||||||
| -73.9742811484852 | 40.775533619083 | 11B-PM-1014-08 | 11B | PM | 10142018 | 8 | Gray | Gray+ | Above Ground | 10 | false | true | false | false | false | false | false | false | false | false | false | false | false | POINT (-73.97428114848522 40.775533619083) | ||||||
| -73.9596413903948 | 40.7903128889029 | 32E-PM-1017-14 | 32E | PM | 10172018 | 14 | Adult | Gray | Gray+ | Nothing selected as Primary. Gray selected as Highlights. Made executive adjustments. | false | false | false | true | true | false | false | false | false | false | false | false | true | POINT (-73.9596413903948 40.7903128889029) | ||||||
| -73.9702676472613 | 40.7762126854894 | 13E-AM-1017-05 | 13E | AM | 10172018 | 5 | Adult | Gray | Cinnamon | Gray+Cinnamon | Above Ground | on tree stump | false | false | false | false | true | false | false | false | false | false | false | false | false | POINT (-73.9702676472613 40.7762126854894) | ||||
| -73.9683613516225 | 40.7725908847499 | 11H-AM-1010-03 | 11H | AM | 10102018 | 3 | Adult | Cinnamon | White | Cinnamon+White | false | false | false | false | true | false | false | false | false | true | false | true | false | POINT (-73.9683613516225 40.7725908847499) | ||||||
| -73.9541201789795 | 40.7931811701082 | 36H-AM-1010-02 | 36H | AM | 10102018 | 2 | Adult | Gray | Gray+ | just outside hectare | Ground Plane | FALSE | false | false | false | false | true | false | false | false | false | false | false | false | false | POINT (-73.9541201789795 40.7931811701082) |
设置点数据地图项的样式
本例中的代码采用的方法是,根据 CombinationofPrimaryandHighlightColor 属性(该属性合并了每只松鼠的主要毛色和次要毛色)为每个点的填充颜色和描边颜色设置样式。
Swift
let mapView = GMSMapView(frame: .zero, mapID: GMSMapID(identifier: "YOUR_MAP_ID"), camera: GMSCameraPosition(latitude: 40.7, longitude: -74.0, zoom: 12))

let layer = mapView.datasetFeatureLayer(of: "YOUR_DATASET_ID")

// Define a point style with fill and radius.
// Apply the style to the datasets features.
layer.style = { feature in
    switch(feature.datasetAttributes["CombinationofPrimaryandHighlightColor"]){
      case "Black+"  :
        let style = MutableFeatureStyle()
        style.fillColor = .black;
        style.pointRadius = 8;
        return style
      case "Cinnamon+"  :
        let style = MutableFeatureStyle()
        style.fillColor = UIColor(red: 139/255, green: 0, blue: 0, alpha: 1);
        style.pointRadius = 8;
        return style
      ...
      default :
        let style = MutableFeatureStyle()
        style.fillColor = .yellow;
        style.pointRadius = 8;
        return style
    }
}
Objective-C
GMSMapView *mapView = [GMSMapView mapWithFrame:CGRectZero mapID:[GMSMapID mapIDWithIdentifier:@"MAP_ID"] camera:[GMSCameraPosition cameraWithLatitude: 40.7 longitude: -74.0 zoom:12]];

GMSDatasetFeatureLayer *layer = [mapView datasetFeatureLayerOfDatasetID:@"YOUR_DATASET_ID"];

// Define a point style with fill and radius.
// Apply the style to the datasets features.
layer.style = ^(GMSDatasetFeature *feature) {
  NSString *attrib = feature.datasetAttributes[@"CombinationofPrimaryandHighlightColor"];
  if ([attrib isEqualToString:@"Black+"])  {
    GMSMutableFeatureStyle *style = [GMSMutableFeatureStyle style];
    style.fillColor = [UIColor blackColor];
    style.pointRadius = 8;
    return style;
  } else if([attrib isEqualToString:@"Cinnamon+"]) {
    GMSMutableFeatureStyle *style = [GMSMutableFeatureStyle style];
    style.fillColor = [UIColor colorWithRed:139.0f/255.0f
                                      green:0.0f
                                        blue:0.0f
                                      alpha:1.0f];
    style.pointRadius = 8;
    return style;
  }
  ...
  else {
    GMSMutableFeatureStyle *style = [GMSMutableFeatureStyle style];
    style.fillColor = [UIColor yellowColor];
    style.pointRadius = 8;
    return style;
  }
};
多边形数据的样式设置示例
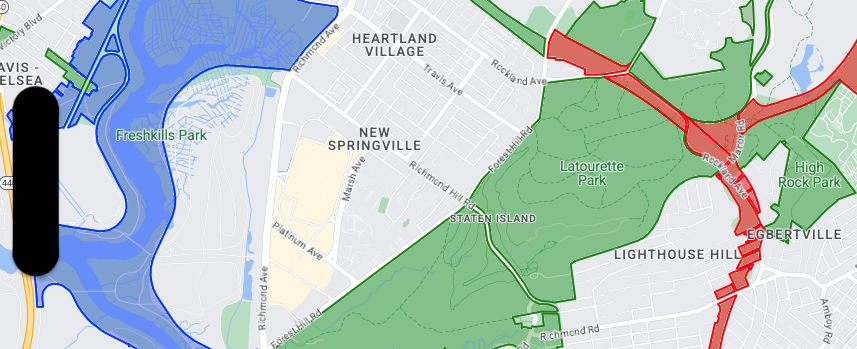
本例演示了如何为基于多边形几何图形的数据地图项设置样式。

关于数据集
本例中使用的数据集描绘的是纽约市的公园。以下内容摘录自 GeoJSON 数据集文件,显示了一个具有代表性的地图项条目。
{
  "type": "Feature",
  "properties": {
    "jurisdiction": "DPR",
    "mapped": "False",
    "zipcode": "11356",
    "acres": "0.05",
    "location": "College Pl., College Pt. Blvd., bet. 11 Ave. and 12 Ave.",
    "nys_assembly": "27",
    "councildistrict": "19",
    "url": "http://www.nycgovparks.org/parks/Q042/",
    "typecategory": "Triangle/Plaza",
    "us_congress": "14",
    "eapply": "Poppenhusen Park",
    "parentid": "Q-07",
    "gispropnum": "Q042",
    "retired": "false",
    "communityboard": "407",
    "objectid": "6248",
    "globalid": "F4810079-CBB9-4BE7-BBFA-B3C0C35D5DE5",
    "name311": "Poppenhusen Park",
    "department": "Q-07",
    "pip_ratable": "true",
    "subcategory": "Sitting Area/Triangle/Mall",
    "precinct": "109",
    "permit": "true",
    "acquisitiondate": null,
    "omppropid": "Q042",
    "gisobjid": "100000301",
    "signname": "Poppenhusen Park",
    "address": null,
    "permitparent": "Q-07",
    "class": "PARK",
    "nys_senate": "11",
    "permitdistrict": "Q-07",
    "borough": "Q",
    "waterfront": "false"
  },
  "geometry": {
    "type": "MultiPolygon",
    "coordinates": [
      [
        [
          [
            -73.84575702371716,
            40.78796240884273
          ],
          [
            -73.84593393292693,
            40.78796857347548
          ],
          [
            -73.84577256469657,
            40.787651355629556
          ],
          [
            -73.84575702371716,
            40.78796240884273
          ]
        ]
      ]
    ]
  }
},
设置多边形数据地图项的样式
本例中的代码将特殊颜色应用于 typecategory 为“Undeveloped”或“Parkway”的数据地图项,并将所有其他地图项的颜色设为绿色。
Swift
let mapView = GMSMapView(frame: .zero, mapID: GMSMapID(identifier: "YOUR_MAP_ID"), camera: GMSCameraPosition(latitude: 40.7, longitude: -74.0, zoom: 12))

let layer = mapView.datasetFeatureLayer(of: "YOUR_DATASET_ID")

// Define a polygon style with fill and stroke.
// Apply the style to the datasets features.
layer.style = { feature in
  switch(feature.datasetAttributes["typecategory"]){
    case "Undeveloped"  :
      let style = MutableFeatureStyle()
      style.fillColor = .blue.withAlphaComponent(0.3);
      style.strokeColor = .blue;
      style.strokeWidth = 2.0;
      return style
    case "Parkway"  :
      let style = MutableFeatureStyle()
      style.fillColor = .red.withAlphaComponent(0.3);
      style.strokeColor = .red;
      style.strokeWidth = 2.0;
      return style
    default :
      let style = MutableFeatureStyle()
      style.fillColor = .green.withAlphaComponent(0.3);
      style.strokeColor = .green;
      style.strokeWidth = 2.0;
      return style
  }
}
Objective-C
GMSMapView *mapView = [GMSMapView mapWithFrame:CGRectZero mapID:[GMSMapID mapIDWithIdentifier:@"MAP_ID"] camera:[GMSCameraPosition cameraWithLatitude: 40.7 longitude: -74.0 zoom:12]];

GMSDatasetFeatureLayer *layer = [mapView datasetFeatureLayerOfDatasetID:@"YOUR_DATASET_ID"];

// Define a polygon style with fill and stroke.
// Apply the style to the datasets features.
layer.style = ^(GMSDatasetFeature *feature) {
  NSString *attrib = feature.datasetAttributes[@"typecategory"];
  if ([attrib isEqualToString:@"Undeveloped"]) {
        GMSMutableFeatureStyle *style = [GMSMutableFeatureStyle style];
        style.fillColor = [[UIColor blueColor] colorWithAlphaComponent:0.3];
        style.strokeColor = [UIColor blueColor];
        style.strokeWidth = 2.0;
        return style;
  } else if([attrib isEqualToString:@"Parkway"]) {
        GMSMutableFeatureStyle *style = [GMSMutableFeatureStyle style];
        style.fillColor = [[UIColor redColor] colorWithAlphaComponent:0.3];
        style.strokeColor = [UIColor redColor];
        style.strokeWidth = 2.0;
        return style;
  } else {
        GMSMutableFeatureStyle *style = [GMSMutableFeatureStyle style];
        style.fillColor = [[UIColor greenColor] colorWithAlphaComponent:0.3];
        style.strokeColor = [UIColor greenColor];
        style.strokeWidth = 2.0;
        return style;
    }
  };
多段线数据的样式设置示例
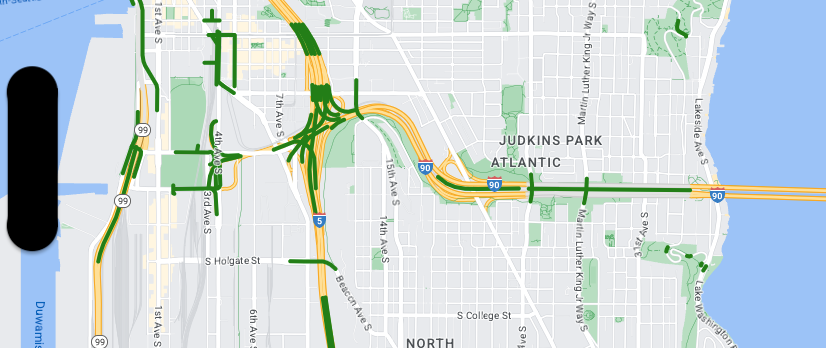
本例演示了如何为基于多段线几何图形的数据地图项设置样式。

关于数据集
本例中使用的数据集描绘的是西雅图地区的桥梁。以下内容摘录自 GeoJSON 数据集文件,显示了一个具有代表性的地图项条目。
{
  "type": "Feature",
  "properties": {
      "OBJECTID": 1,
      "COMPTYPE": 66,
      "COMPKEY": 515774,
      "HANSEGKEY": 489781,
      "UNITID": "BRG-935",
      "UNITTYPE": " ",
      "BRGUNITID": "BRG-935",
      "UNITDESC_BRG": "YALE AVE BR REV LANE OC                                                                                                                                                                                                                                        ",
      "UNITDESC_SEG": "HOWELL ST ON RP BETWEEN HOWELL ST AND I5 SB                                                                                                                                                                                                                    ",
      "INSTDATE": null,
      "EXPDATE": null,
      "STATUS": " ",
      "STATUSDT": null,
      "CONDITION": " ",
      "CONDDT": null,
      "OWN": " ",
      "LSTVERIFY": null,
      "MAINTBY": " ",
      "ADDBY": "GARCIAA",
      "ADDDTTM": "2010-01-21T00:00:00Z",
      "MODBY": null,
      "MODDTTM": null,
      "BR_NBR": 935,
      "BR_CODE": " 935",
      "BR_TYPE": "ST",
      "BR_NAME": "YALE AVE BR REV LANE OC",
      "BR_FACILITIES": "YALE AVE-SR 5 ON RAMP",
      "BR_FEATURES": "SR 5 REV LANE",
      "BR_RATING": 0,
      "BR_INSET": 1,
      "BR_GEO": "DT",
      "BR_OWNER": "DOT",
      "BR_OWNER_NAME": "State of Washington",
      "GEOBASID": 0,
      "XGEOBASID": 0,
      "GISSEGKEY": 489781,
      "EARTHQUAKE_RESPONSE_TEAM": " ",
      "SHAPE_Length": 220.11891836147655
  },
  "geometry": {
      "type": "LineString",
      "coordinates": [
          [
              -122.329201929090928,
              47.616910448708538
          ],
          [
              -122.329206483407461,
              47.616976719821004
          ],
          [
              -122.32921802149356,
              47.617042137515213
          ],
          [
              -122.329236413912909,
              47.617105967923777
          ],
          [
              -122.329261454336034,
              47.617167494985758
          ],
          [
              -122.329292861855023,
              47.617226028479571
          ],
          [
              -122.329330284134699,
              47.617280911766009
          ],
          [
              -122.329373301365223,
              47.617331529154569
          ],
          [
              -122.329421430971635,
              47.617377312810319
          ],
          [
              -122.329474133027375,
              47.617417749124023
          ],
          [
              -122.32953081631139,
              47.617452384473893
          ]
      ]
  }
},
设置多段线数据地图项的样式
以下代码段会将相同的样式直接应用于所有数据地图项。
Swift
// Define a style with green fill and stroke.
// Apply the style to the datasets features.
layer.style = { feature in
  let style = MutableFeatureStyle()
  style.fillColor = .green.withAlphaComponent(0.5);
  style.strokeColor = [UIColor greenColor];
  style.strokeWidth = 2.0;
  return style
}
Objective-C
// Define a style with green fill and stroke.
// Apply the style to the datasets features.
layer.style = ^(GMSDatasetFeature *feature) {
  GMSMutableFeatureStyle *style = [GMSMutableFeatureStyle style];
  style.fillColor = [[UIColor greenColor] colorWithAlphaComponent:0.5];
  style.strokeColor = [UIColor greenColor];
  style.strokeWidth = 2.0;
  return style;
};

