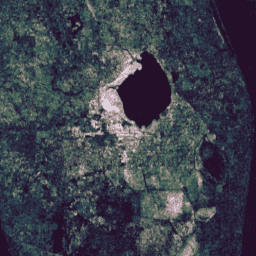
האוסף הזה מכיל תוצאות שחושבו מראש מהרצת האלגוריתם Continuous Change Detection and Classification (CCDC) על נתוני השתקפות פני השטח של Landsat במשך 20 שנה. CCDC הוא אלגוריתם לזיהוי נקודות שבירה שמשתמש בהתאמה הרמונית עם סף RMSE דינמי כדי לזהות נקודות שבירה בנתוני סדרות זמנים.
מערך הנתונים נוצר מנתוני Landsat 5, 7 ו-8 Collection-1, Tier-1, surface reflectance time series, באמצעות כל התמונות שצולמו בשעות היום בין 1999-01-01 לבין 2019-12-31. כל תמונה עברה עיבוד מקדים כדי להסתיר פיקסלים שזוהו כעננים, צל או שלג (לפי פס 'pixel_qa'), פיקסלים רוויים ופיקסלים עם אטימות אטמוספרית > 300 (כפי שזוהה על ידי הפסים 'sr_atmos_opacity' ו-'sr_aerosol'). הסרנו כפילויות של פיקסלים בחפיפה בין סצנות מצפון לדרום. התוצאות הופקו באריחים של 2 מעלות לכל שטחי היבשה בין קו רוחב 60-° לבין קו רוחב 85+°.
התמונות מתאימות לפונקציה mosaic() כדי ליצור תמונה גלובלית אחת.
אלגוריתם ה-CCDC הופעל עם פרמטרי האלגוריתם שמוגדרים כברירת מחדל, מלבד dateFormat:
tmaskBands: ['green', 'swir']
minObservations: 6
chiSquareProbability: 0.99
minNumOfYearsScaler: 1.33
dateFormat: 1 (שנה חלקית)
lambda: 20
maxIterations: 25000
כל פיקסל בפלט מקודד באמצעות מערכים באורך משתנה. האורך החיצוני של כל מערך (ציר 0) תואם למספר נקודות עצירה שנמצאו במיקום הזה. הפסים של coefs מכילים מערכים דו-ממדיים, שכל מערך פנימי מכיל את גורמי קנה המידה של 8 המונחים במודל ההרמוני הלינארי, בסדר הבא: [offset, t, cos(ωt), sin(ωt), cos(2ωt), sin(2ωt), cos(3ωt), sin(3ωt)], כאשר ω = 2Π. המודלים מותאמים כדי להפיק יחידות השתקפות (0.0 עד 1.0) עבור הפסים האופטיים ומעלות (K) חלקי 100.0 עבור הפס התרמי.
הערה: רצועות הפלט הן מערכים, ואפשר לבצע דגימת יתר שלהן רק באמצעות מדיניות פירמידה של SAMPLE. ברמות זום נמוכות יותר, התוצאות בדרך כלל כבר לא מייצגות את הנתונים ברזולוציה מלאה, למשל, אפשר לראות את הגבולות של המשבצות בגלל המסכות שעברו דגימה חוזרת.
לכן לא מומלץ להשתמש במערך הנתונים הזה ברזולוציות נמוכות מ-240 מ'/פיקסל.
אין תוכניות להוסיף למערך הנתונים הזה נכסים משנת 2019 ואילך.
תחום תדרים
גודל הפיקסל 30 מטרים
תחום תדרים
שם
גודל הפיקסל
תיאור
tStart
מטרים
מערך חד-ממדי שמכיל את תאריך ההתחלה של כל פלח (שנה חלקית).
tEnd
מטרים
מערך חד-ממדי שמכיל את התאריך של סוף כל פלח (שנה חלקית).
tBreak
מטרים
מערך חד-ממדי שמכיל את התאריך של נקודת ההפסקה שזוהתה בכל פלח (שנה חלקית).
numObs
מטרים
מערך חד-ממדי שמכיל את מספר התצפיות שנמצאו בכל פלח.
changeProb
מטרים
פסאודו-הסתברות לכך שנקודת העצירה שזוהתה היא אמיתית.
BLUE_coefs
מטרים
מערך דו-ממדי שמכיל מקדמים של מודל הרמוני עבור הפס הכחול, לכל פלח.
GREEN_coefs
מטרים
מערך דו-ממדי שמכיל את המקדמים של המודל ההרמוני עבור הפס הירוק, לכל פלח.
RED_coefs
מטרים
מערך דו-ממדי שמכיל מקדמים של מודל הרמוני עבור הפס האדום, לכל פלח.
NIR_coefs
מטרים
מערך דו-ממדי שמכיל את המקדמים של המודל ההרמוני עבור פס התדרים של קרוב לאינפרא-אדום, לכל פלח.
SWIR1_coefs
מטרים
מערך דו-ממדי שמכיל מקדמי מודל הרמוני עבור פס הגלים הקצרים בתחום האינפרא-אדום (1.55 מיקרומטר עד 1.75 מיקרומטר), לכל קטע.
SWIR2_coefs
מטרים
מערך דו-ממדי שמכיל את המקדמים של המודל ההרמוני עבור פס הגלים האינפרא-אדום הקצר (2.09μm-2.35μm), לכל קטע.
TEMP_coefs
מטרים
מערך דו-ממדי שמכיל את המקדמים של המודל ההרמוני עבור הפס התרמי, לכל פלח.
BLUE_rmse
מטרים
מערך חד-ממדי שמכיל את שגיאת השורש הממוצעת (RMSE) של המודל עבור הפס הכחול, לכל פלח.
GREEN_rmse
מטרים
מערך חד-ממדי שמכיל את השגיאה הריבועית הממוצעת (RMSE) של המודל עבור הפס הירוק, לכל פלח.
RED_rmse
מטרים
מערך חד-ממדי שמכיל את השגיאה הריבועית הממוצעת (RMSE) של המודל עבור הפס האדום, לכל פלח.
NIR_rmse
מטרים
מערך חד-ממדי שמכיל את השגיאה הריבועית הממוצעת (RMSE) של המודל עבור פס התדרים הקרוב לאינפרא-אדום, לכל פלח.
SWIR1_rmse
מטרים
מערך חד-ממדי שמכיל את השגיאה הממוצעת של שורש הריבוע (RMSE) של המודל עבור פס הגלים הקצרים של האינפרא-אדום (1.55 מיקרומטר עד 1.75 מיקרומטר), לכל קטע.
SWIR2_rmse
מטרים
מערך חד-ממדי שמכיל את השגיאה הריבועית הממוצעת (RMSE) של המודל עבור פס הגלים הקצרים בתחום האינפרא-אדום (2.09 מיקרומטר עד 2.35 מיקרומטר), לכל קטע.
TEMP_rmse
מטרים
מערך חד-ממדי שמכיל את שגיאת השורש הממוצעת (RMSE) של המודל עבור הפס התרמי, לכל פלח.
BLUE_magnitude
מטרים
מערך חד-ממדי שמכיל את גודל נקודת השבירה שזוהתה עבור הפס הכחול, לכל פלח.
GREEN_magnitude
מטרים
מערך חד-ממדי שמכיל את גודל נקודת השבירה שזוהתה עבור הטווח הירוק, לכל פלח.
RED_magnitude
מטרים
מערך חד-ממדי שמכיל את גודל נקודת השבירה שזוהתה עבור הפס האדום, לכל פלח.
NIR_magnitude
מטרים
מערך חד-ממדי שמכיל את הגודל של נקודת השבירה שזוהתה עבור פס התדרים של קרוב לאדום, לכל פלח.
SWIR1_magnitude
מטרים
מערך חד-ממדי שמכיל את הגודל של נקודת השבירה שזוהתה עבור פס הגלים הקצרים בתחום האינפרא-אדום (1.55 מיקרומטר עד 1.75 מיקרומטר), לכל פלח.
SWIR2_magnitude
מטרים
מערך חד-ממדי שמכיל את הגודל של נקודת השבירה שזוהתה עבור פס הגלים הקצרים בתחום האינפרא-אדום 2 (2.09 מיקרומטר עד 2.35 מיקרומטר), לכל פלח.
TEMP_magnitude
מטרים
מערך חד-ממדי שמכיל את גודל נקודת השבירה שזוהתה עבור הפס התרמי, לכל פלח.
האוסף הזה מכיל תוצאות שחושבו מראש מהרצת האלגוריתם Continuous Change Detection and Classification (CCDC) על נתוני השתקפות פני השטח של Landsat במשך 20 שנה. CCDC הוא אלגוריתם לזיהוי נקודות שבירה שמשתמש בהתאמה הרמונית עם סף RMSE דינמי כדי לזהות נקודות שבירה בנתוני סדרות זמנים. מערך הנתונים נוצר מתוך …
[null,null,[],[[["\u003cp\u003eThe Google Global Landsat-based CCDC Segments dataset provides precomputed results of the Continuous Change Detection and Classification (CCDC) algorithm applied to 20 years of Landsat data (1999-2019).\u003c/p\u003e\n"],["\u003cp\u003eCCDC detects breakpoints in time-series data using harmonic fitting with a dynamic RMSE threshold, identifying changes in land cover and land use.\u003c/p\u003e\n"],["\u003cp\u003eThe dataset covers landmasses between -60° and +85° latitude at a 30-meter resolution, derived from Landsat 5, 7, and 8 Collection-1, Tier-1 surface reflectance data.\u003c/p\u003e\n"],["\u003cp\u003eEach pixel contains information about detected breakpoints, including start and end dates, magnitude of change, and harmonic model coefficients for various spectral bands.\u003c/p\u003e\n"],["\u003cp\u003eThe dataset is available in Earth Engine and is intended for research, education, and non-profit use under a CC-BY-4.0 license.\u003c/p\u003e\n"]]],["The dataset, available from 1999-01-01 to 2020-01-01 via Google Earth Engine, provides precomputed results from the Continuous Change Detection and Classification (CCDC) algorithm applied to 20 years of Landsat data. Using harmonic fitting, CCDC identifies breakpoints in time-series data across landmasses between -60° and +85° latitude. The output, at 30-meter resolution, includes start, end, and breakpoint dates, observation counts, change probabilities, model coefficients, RMSE, and breakpoint magnitudes for various spectral bands.\n"],null,["# Google Global Landsat-based CCDC Segments (1999-2019)\n\nDataset Availability\n: 1999-01-01T00:00:00Z--2020-01-01T00:00:00Z\n\nDataset Provider\n:\n\n\n [Google](https://earthengine.google.com/)\n\nTags\n:\n[change-detection](/earth-engine/datasets/tags/change-detection) [google](/earth-engine/datasets/tags/google) [landcover](/earth-engine/datasets/tags/landcover) [landsat-derived](/earth-engine/datasets/tags/landsat-derived) [landuse](/earth-engine/datasets/tags/landuse) [landuse-landcover](/earth-engine/datasets/tags/landuse-landcover) \n\n#### Description\n\nThis collection contains precomputed results from running the\nContinuous Change Detection and Classification (CCDC) algorithm on\n20 years of Landsat surface reflectance data. CCDC is a break-point\nfinding algorithm that uses harmonic fitting with a dynamic RMSE\nthreshold to detect breakpoints in time-series data.\n\nThe dataset was created from the Landsat 5, 7, and 8 Collection-1, Tier-1,\nsurface reflectance time series, using all daytime images between 1999-01-01\nand 2019-12-31. Each image was preprocessed to mask pixels identified as\ncloud, shadow, or snow (according to the 'pixel_qa' band), saturated pixels,\nand pixels with an atmospheric opacity \\\u003e 300 (as identified by the\n'sr_atmos_opacity' and 'sr_aerosol' bands). Pixels repeated in\nnorth/south scene overlap were deduplicated. The results were\noutput in 2-degree tiles for all landmasses between -60° and +85° latitude.\nThe images are suitable to simply mosaic() into one global image.\n\nThe CCDC algorithm was run with the default algorithm parameters except for\nthe dateFormat:\n\n- tmaskBands: \\['green', 'swir'\\]\n- minObservations: 6\n- chiSquareProbability: 0.99\n- minNumOfYearsScaler: 1.33\n- dateFormat: 1 (fractional year)\n- lambda: 20\n- maxIterations: 25000\n\nEach pixel in the output is encoded using variable length arrays. The outer\nlength of each array (axis 0) corresponds to the number of breakpoints\nfound at that location. The coefs bands contain 2-D arrays, where each inner\narray contains the scaling factors for the 8 terms in the linear harmonic\nmodel, in the order: \\[offset, t, cos(ωt), sin(ωt), cos(2ωt),\nsin(2ωt), cos(3ωt), sin(3ωt)\\], where ω = 2Π. The\nmodels are scale to produce refelectance units (0.0 - 1.0) for the optical\nbands and degrees (K) / 100.0 for the thermal band.\n\nNote that since the output bands are arrays and can only be downsampled\nusing a SAMPLE pyramiding policy. At lower zoom levels, the\nresults are usually no longer representative of the full-resolution data,\nand, for instance, tile boundaries can be seen due to the downsampled masks.\nIt's therefore not recommended to use this dataset at resolutions less than\n240m/pixel.\n\nThere are no current plans to add post-2019 assets to this dataset.\n\n### Bands\n\n\n**Pixel Size**\n\n30 meters\n\n**Bands**\n\n| Name | Pixel Size | Description |\n|-------------------|------------|------------------------------------------------------------------------------------------------------------------------------------|\n| `tStart` | meters | 1-D Array containing the date of the start of each segment (fractional year). |\n| `tEnd` | meters | 1-D Array containing the date of the end of each segment (fractional year). |\n| `tBreak` | meters | 1-D Array containing the date of the detected breakpoint of each segment (fractional year). |\n| `numObs` | meters | 1-D Array containing the number of observations found in each segment. |\n| `changeProb` | meters | A pseudo-probability of the detected breakpoint being real. |\n| `BLUE_coefs` | meters | 2-D array containing harmonic model coefficients for the blue band, for each segment. |\n| `GREEN_coefs` | meters | 2-D array containing harmonic model coefficients for the green band, for each segment. |\n| `RED_coefs` | meters | 2-D array containing harmonic model coefficients for the red band, for each segment. |\n| `NIR_coefs` | meters | 2-D array containing harmonic model coefficients for the near-infrared band, for each segment. |\n| `SWIR1_coefs` | meters | 2-D array containing harmonic model coefficients for the shortwave-infrared (1.55μm-1.75μm) band, for each segment. |\n| `SWIR2_coefs` | meters | 2-D array containing harmonic model coefficients for the shortwave-infrared (2.09μm-2.35μm) band, for each segment. |\n| `TEMP_coefs` | meters | 2-D array containing harmonic model coefficients for the thermal band, for each segment. |\n| `BLUE_rmse` | meters | 1-D array containing the RMSE of the model for the blue band, for each segment. |\n| `GREEN_rmse` | meters | 1-D array containing the RMSE of the model for the green band, for each segment. |\n| `RED_rmse` | meters | 1-D array containing the RMSE of the model for the red band, for each segment. |\n| `NIR_rmse` | meters | 1-D array containing the RMSE of the model for the near-infrared band, for each segment. |\n| `SWIR1_rmse` | meters | 1-D array containing the RMSE of the model for the the shortwave-infrared (1.55μm-1.75μm) band, for each segment. |\n| `SWIR2_rmse` | meters | 1-D array containing the RMSE of the model for the shortwave-infrared (2.09μm-2.35μm) band, for each segment. |\n| `TEMP_rmse` | meters | 1-D array containing the RMSE of the model for the thermal band, for each segment. |\n| `BLUE_magnitude` | meters | 1-D array containing the magnitude of the detected breakpoint for the blue band, for each segment. |\n| `GREEN_magnitude` | meters | 1-D array containing the magnitude of the detected breakpoint for the green band, for each segment. |\n| `RED_magnitude` | meters | 1-D array containing the magnitude of the detected breakpoint for the red band, for each segment. |\n| `NIR_magnitude` | meters | 1-D array containing the magnitude of the detected breakpoint for the near-infrared band, for each segment. |\n| `SWIR1_magnitude` | meters | 1-D array containing the magnitude of the detected breakpoint for the shortwave-infrared-1 (1.55μm-1.75μm) band, for each segment. |\n| `SWIR2_magnitude` | meters | 1-D array containing the magnitude of the detected breakpoint for the shortwave-infrared-2 (2.09μm-2.35μm) band, for each segment. |\n| `TEMP_magnitude` | meters | 1-D array containing the magnitude of the detected breakpoint for the thermal band, for each segment. |\n\n### Terms of Use\n\n**Terms of Use**\n\n[CC-BY-4.0](https://spdx.org/licenses/CC-BY-4.0.html)\n**Important:** Earth Engine is a platform for petabyte-scale scientific analysis and visualization of geospatial datasets, both for public benefit and for business and government users. Earth Engine is free to use for research, education, and nonprofit use. To get started, please [register for Earth Engine access.](https://console.cloud.google.com/earth-engine) \n[Google Global Landsat-based CCDC Segments (1999-2019)](/earth-engine/datasets/catalog/GOOGLE_GLOBAL_CCDC_V1) \nThis collection contains precomputed results from running the Continuous Change Detection and Classification (CCDC) algorithm on 20 years of Landsat surface reflectance data. CCDC is a break-point finding algorithm that uses harmonic fitting with a dynamic RMSE threshold to detect breakpoints in time-series data. The dataset was created from the ... \nGOOGLE/GLOBAL_CCDC/V1, change-detection,google,landcover,landsat-derived,landuse,landuse-landcover \n1999-01-01T00:00:00Z/2020-01-01T00:00:00Z \n-60 -180 72 180 \nGoogle Earth Engine \nhttps://developers.google.com/earth-engine/datasets\n\n- [](https://doi.org/https://earthengine.google.com/)\n- [](https://doi.org/https://developers.google.com/earth-engine/datasets/catalog/GOOGLE_GLOBAL_CCDC_V1)"]]