- 利用可能なデータセットの期間
- 1983-01-01T00:00:00Z–2016-12-31T00:00:00Z
- データセット プロデューサー
- UCSB/CHG
- ケイデンス
- 1 日
- タグ
説明
Climate Hazards Center InfraRed Temperature with Stations の日次気温データ プロダクト(CHIRTS-daily、Verdin 他、2020 年)は、準グローバルな高解像度グリッド データセット(解像度 0.05° × 0.05°、60°S ~ 70°N)です。このデータセットは、日次の最低気温(Tmin)と最高気温(Tmax)、および飽和水蒸気圧(SVP)、水蒸気圧不足(VPD)、相対湿度(RH)、暑さ指数(HI)の 4 つの派生変数を提供します。CHIRTS 温度プロダクトは、特に観測所の密度が低い地域で、極端な温度と変動の分析をサポートするように設計されています。
CHIRTS-daily は、高品質で高解像度の月ごとの最高気温データセットである Climate Hazards Center InfraRed Temperature with Stations 月ごとの最高気温気候記録(CHIRTSmax; Funk et al. 2019)と、欧州中期気象予報センター(ECMWF)の再解析 v5(ERA5)の日ごとの気温を統合して作成されます。その結果、月単位の CHIRTSmax の空間時間情報と、ERA5 の日単位および日中の温度変動を維持する、高解像度の日単位の温度データセットが得られます。月間の CHIRTSmax は、次のものに基づいています。
地統計回帰と、FAO 観測所の長期平均、ERA5 の気温、その他のいくつかの地理的予測変数を使用して構築された Tmax 気候学。
約 15,000 件の現地観測と高解像度(0.05° × 0.05°)の衛星観測を使用して推定された Tmax の変動。これらのデータは、Berkeley Earth と Global Telecommunication System(GTS)の観測所レポート、および雲でスクリーニングされた GridSat 静止衛星の熱赤外線輝度温度から取得されています。
1 日の Tmax 値は、ダウンスケールされた ERA5 Tmax 異常値と高解像度の CHIRTSmax を使用して生成されます。1 日の Tmin 値は、ダウンスケールされた ERA5 の日内温度範囲(Tmax - Tmin)を削除することで作成されます。1 日の SVP、VPD、RH、HI は、CHIRTS の 1 日の Tmin と Tmax を使用して計算されます。また、他の気象変数の 1 時間ごとの ERA5 入力も使用されます(Williams 他、2024 年を参照)。CHIRTS-daily、バージョン 1 は 1983 年から 2016 年までの期間を対象としています。
バンド
バンド
ピクセルサイズ: 5,566 メートル(すべてのバンド)
| 名前 | 単位 | 最小 | 最大 | ピクセルサイズ | 説明 |
|---|---|---|---|---|---|
minimum_temperature |
°C | 5,566 メートル | 24 時間の間に地表から 2 メートルの高さで記録された最低気温。 |
||
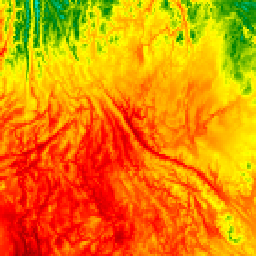
maximum_temperature |
°C | 10* | 40* | 5,566 メートル | 24 時間の間に地上 2 メートルで記録された最高気温。 |
saturation_vapor_pressure |
kPa | 5,566 メートル | 地上 2 メートルの特定の温度と気圧で空気が保持できる最大水蒸気量。 |
||
vapor_pressure_deficit |
kPa | 5,566 メートル | 地上 2 メートルでの飽和水蒸気圧と実際の水蒸気圧の差。 |
||
relative_humidity |
% | 5,566 メートル | 地上 2 メートルでの、空気中の実際の水蒸気量と、その温度と気圧で保持できる最大水蒸気量(飽和水蒸気圧)の比率。 |
||
heat_index |
°F | 5,566 メートル | 気温と湿度を組み合わせたときに感じる暑さの指標。 |
利用規約
利用規約
このデータセットはパブリック ドメインにあります。法律で認められる範囲内で、Chris Funk は、Climate Hazards InfraRed Temperature with Stations の日別温度データ プロダクト(CHIRTS-daily)に対するすべての著作権および関連する権利または隣接権を放棄しました。
引用
Verdin, A.、C. Funk, P. Peterson, M. Landsfeld, C. Tuholske、Grace、K.、2020 年: CHIRTS-daily 準全球高解像度日別気温データセットの開発と検証。Scientific Data, 7(1), 303. doi: 10.1038/s41597-020-00643-7
Funk, C.、P. Peterson, S. Peterson, S. Shukla、F. Davenport, J. Michaelsen, K.R. Knapp, M. Landsfeld, G. Husak, L. Harrison, J. Rowland, M. Budde, A. Meiburg, T. Dinku, D. Pedreros、N. Mata, 2019: A High-Resolution 1983-2016 Tmax Climate Data Record Based on Infrared Temperatures and Stations by the Climate Hazard Center(気候ハザード センターの赤外線温度と観測所に基づく 1983 ~ 2016 年の高解像度 Tmax 気候データ記録)。J. Climate, 32, 5639-5658. doi:10.1175/JCLI-D-18-0698.1
Williams, E.、C. Funk, P. Peterson、C. Tuholske(2024 年)。熱関連の極端な現象の評価のための、高解像度の気候変動の観測と予測。Scientific Data、11(1)、261。 doi: 10.1038/s41597-024-03074-w
DOI
Earth Engine で探索する
コードエディタ(JavaScript)
var dataset = ee.ImageCollection('UCSB-CHG/CHIRTS/DAILY')
                  .filter(ee.Filter.date('2016-05-01', '2016-05-03'));
var maximumTemperature = dataset.select('maximum_temperature');
var visParams = {
  min: 10,
  max: 30,
  palette: ['darkblue', 'blue', 'cyan', 'green', 'yellow', 'orange', 'red','darkred'],
};
Map.setCenter(-104.28, 46.07, 3);
Map.addLayer(maximumTemperature, visParams, 'Maximum temperature');