-
GHSL:城镇化程度 1975-2030 V2-0 (P2023A)
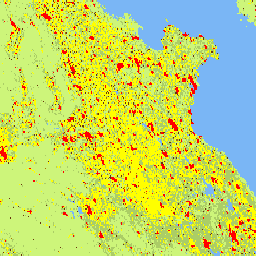
此栅格数据集表示全球多时态城乡分类,应用了联合国统计委员会推荐的“城镇化程度”第一阶段方法,基于 GHSL 项目生成的 1975-2030 年间(以 5 年为间隔)全球网格化人口和建成区表面数据。城镇化程度 … ghsl jrc population sdg settlement -
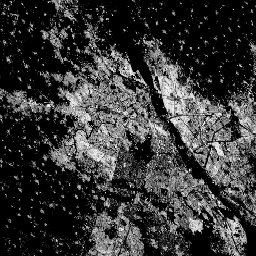
GHSL:全球建筑高度 2018 (P2023A)

此空间栅格数据集以 100 米的分辨率描绘了 2018 年的全球建筑高度分布情况。用于预测建筑高度的输入数据包括 ALOS 全球数字表面模型(30 米)、NASA 航天飞机雷达地形测绘任务 … alos building built built-environment builtup copernicus -
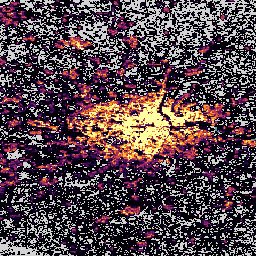
GHSL:全球建筑体积 1975-2030 (P2023A)

此栅格数据集描绘了全球建筑体积分布情况,以每 100 米网格单元的立方米数表示。该数据集测量了总建筑体积以及分配给以非住宅 (NRES) 为主的网格单元的建筑体积。估算基于建成区 … alos building built-environment copernicus dem ghsl -
GHSL:全球建成区表面 10 米 (P2023A)

此栅格数据集描绘了 2018 年从 S2 图像数据中观察到的建成区表面分布情况,以每 10 米网格单元的平方米数表示。该数据集测量了:a) 总建成区表面,以及 b) 分配给以非住宅 (NRES) 为主的网格单元的建成区表面。 built built-environment builtup copernicus ghsl jrc -
GHSL:全球建成区表面 1975-2030 (P2023A)
此栅格数据集描绘了建成区表面分布情况,以每 100 米网格单元的平方米数表示。该数据集测量了:a) 总建成区表面,以及 b) 分配给以非住宅 (NRES) 为主的网格单元的建成区表面。数据经过时空插值或 … built built-environment builtup copernicus ghsl jrc -
GHSL:全球人口表面 1975-2030 (P2023A)
此栅格数据集描绘了住宅人口的空间分布情况,以单元格的居民绝对人数表示。1975 年至 2020 年间(以 5 年为间隔)的住宅人口估计值以及 2025 年和 2030 年的预测值(源自 CIESIN GPWv4.11)已从人口普查或 … ghsl jrc population sdg -
GHSL:全球居住地特征 (10 米) 2018 (P2023A)
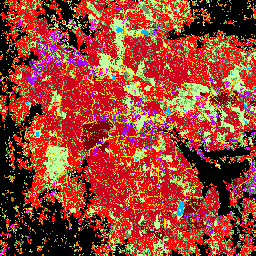
此空间栅格数据集以 10 米的分辨率描绘了人类居住地,并根据建成环境的功能和高度相关组件描述了其内部特征。如需详细了解 GHSL 数据产品,请参阅 GHSL Data Package 2023 报告 … building built builtup copernicus ghsl height
Datasets tagged ghsl in Earth Engine
[null,null,[],[],["The content describes multiple Global Human Settlement Layer (GHSL) datasets, each focused on different aspects of human settlements. These datasets include: settlement characteristics, building height, built-up surface area (at 10m and 100m), building volume, population distribution, and degree of urbanization. The data spans from 1975 to 2030, providing historical data and projections, all derived from satellite imagery and census information. Each dataset measures in square or cubic meters.\n"]]