上一部分介绍了一系列模型指标,所有这些指标都是基于单个分类阈值值计算得出的。但是,如果您想评估模型在所有可能阈值下的质量,则需要使用不同的工具。
接收器操作特征曲线 (ROC)
ROC 曲线直观地显示了所有阈值下的模型性能。名称的长版本“接收器操作特性”源自二战雷达检测。
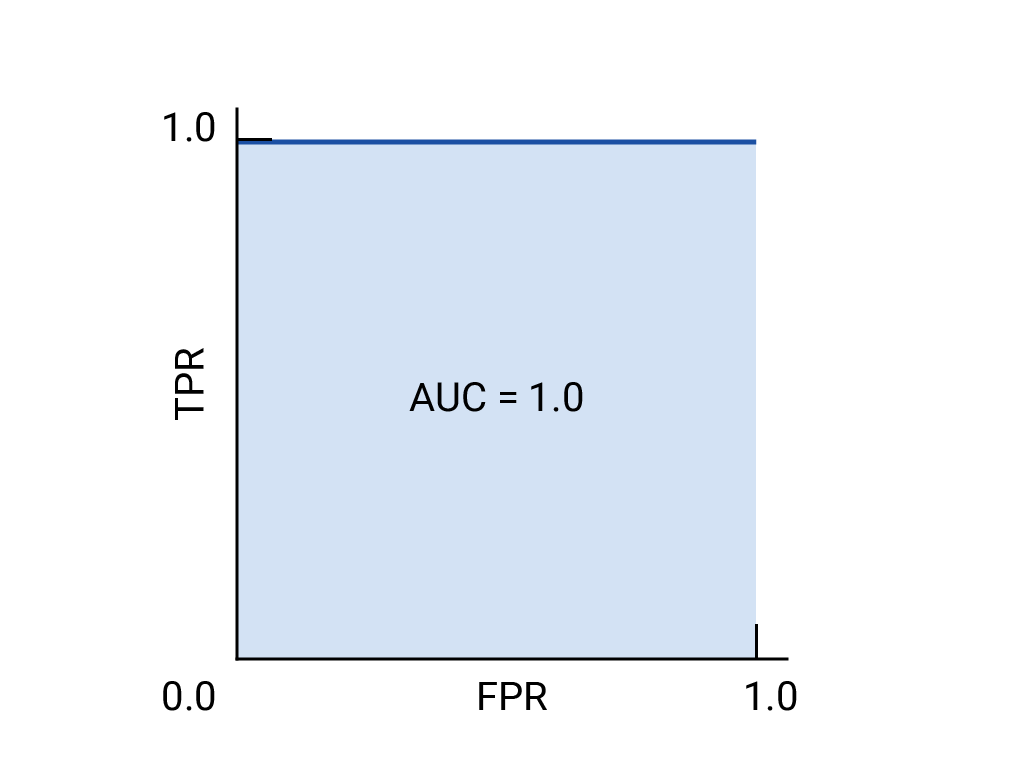
绘制 ROC 曲线的方法是:计算每个可能的阈值(在实践中,是按选定的间隔)的真正例率 (TPR) 和假正例率 (FPR),然后将 TPR 与 FPR 绘制到图表中。完美的模型在某个阈值下的 TPR 为 1.0,FPR 为 0.0,如果忽略所有其他阈值,则可以用 (0, 1) 点表示,也可以用以下方式表示:
曲线下面积 (AUC)
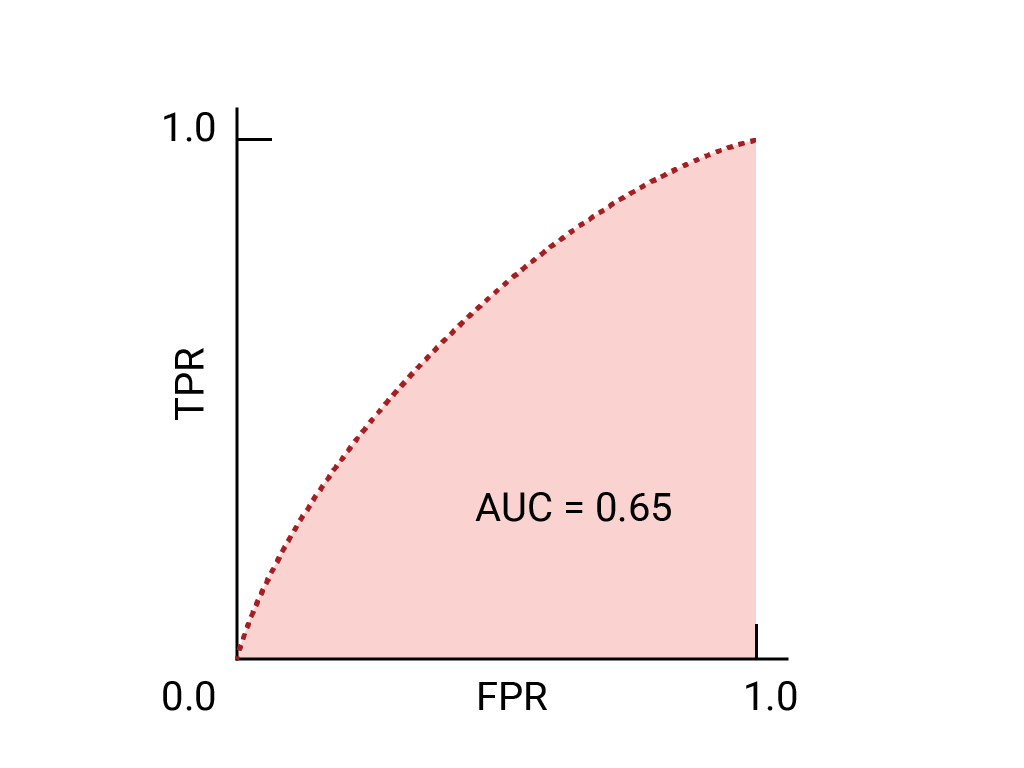
ROC 曲线下面积 (AUC) 表示,如果给定随机选择的正例和负例,模型将正例排在负例之上的概率。
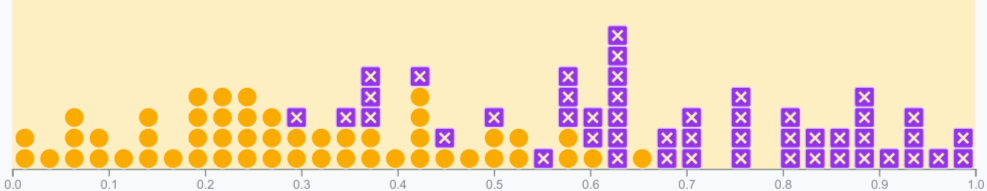
上面的完美模型包含边长为 1 的正方形,其曲线下面积 (AUC) 为 1.0。这意味着,模型将随机选择的正例正确排在随机选择的负例之上的概率为 100%。换句话说,查看下方的数据点分布情况,AUC 可提供模型将随机选择的方形放置在随机选择的圆形右侧的概率,而不会受到阈值设置位置的影响。
更具体地说,AUC 为 1.0 的垃圾邮件分类器始终会为随机垃圾邮件分配比随机合规电子邮件更高的垃圾邮件概率。每封电子邮件的实际分类取决于您选择的阈值。
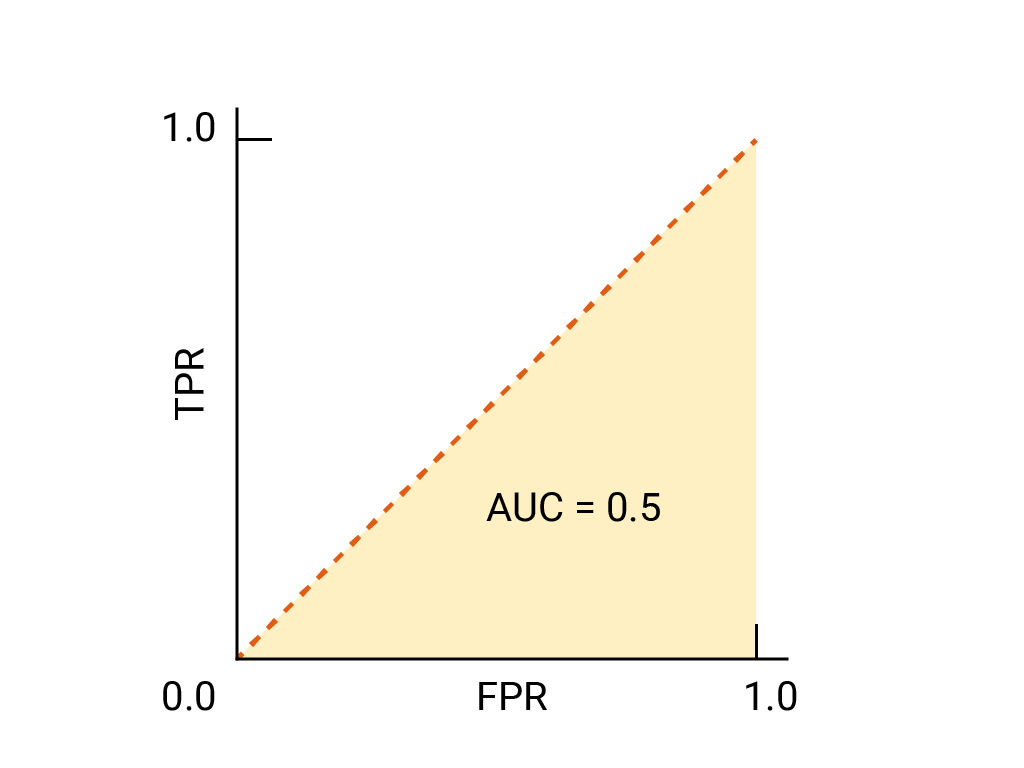
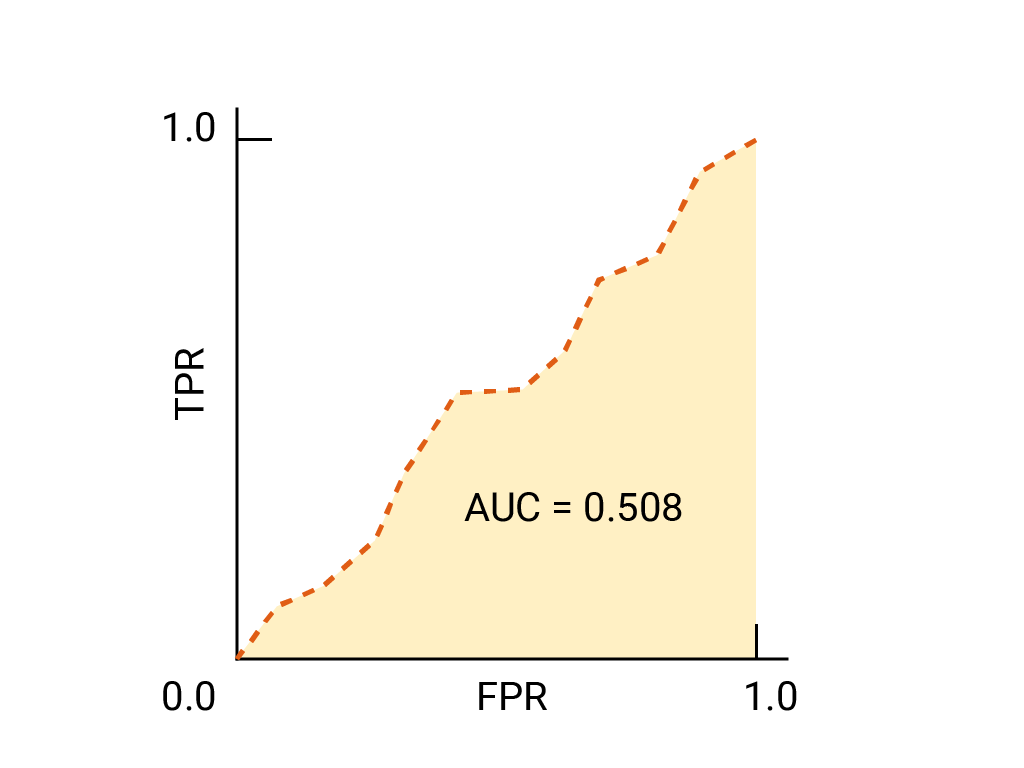
对于二元分类器,如果模型的效果与随机猜测或抛硬币的效果完全一样,则其 ROC 曲线为从 (0,0) 到 (1,1) 的对角线。AUC 为 0.5,表示正确对随机正例和负例进行排名的概率为 50%。
在垃圾邮件分类器示例中,AUC 为 0.5 的垃圾邮件分类器仅在 50% 的情况下会将随机垃圾邮件的垃圾邮件概率设为高于随机合法邮件的垃圾邮件概率。
(可选,高级)精确率与召回率曲线
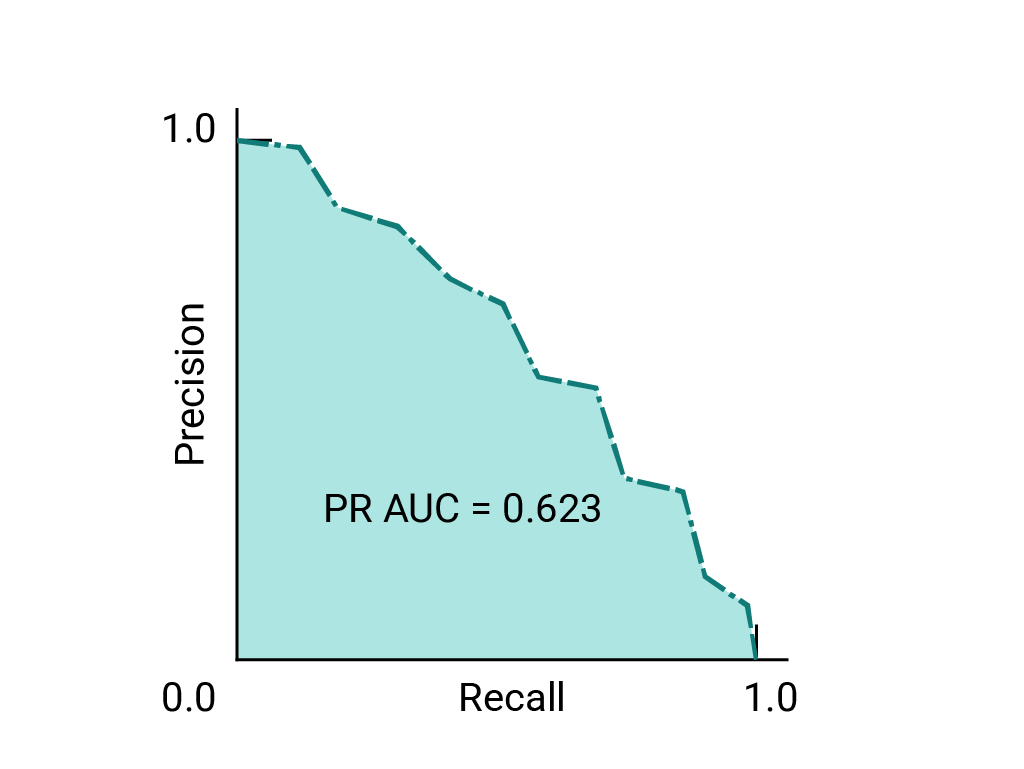
如果数据集在类别之间大致平衡,AUC 和 ROC 非常适合比较模型。当数据集不均衡时,准确率-召回率曲线 (PRC) 和这些曲线下的面积可以更好地直观比较模型性能。精确率/召回率曲线的创建方法是,在 y 轴上绘制精确率,在 x 轴上绘制所有阈值下的召回率。
用于选择模型和阈值的 AUC 和 ROC
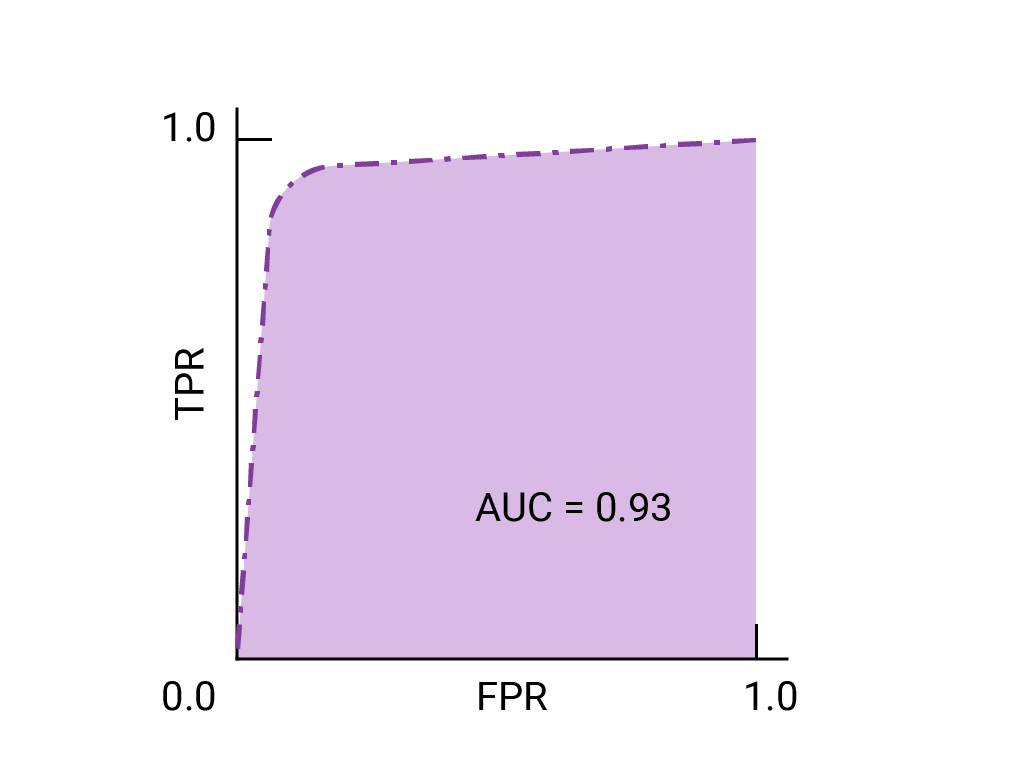
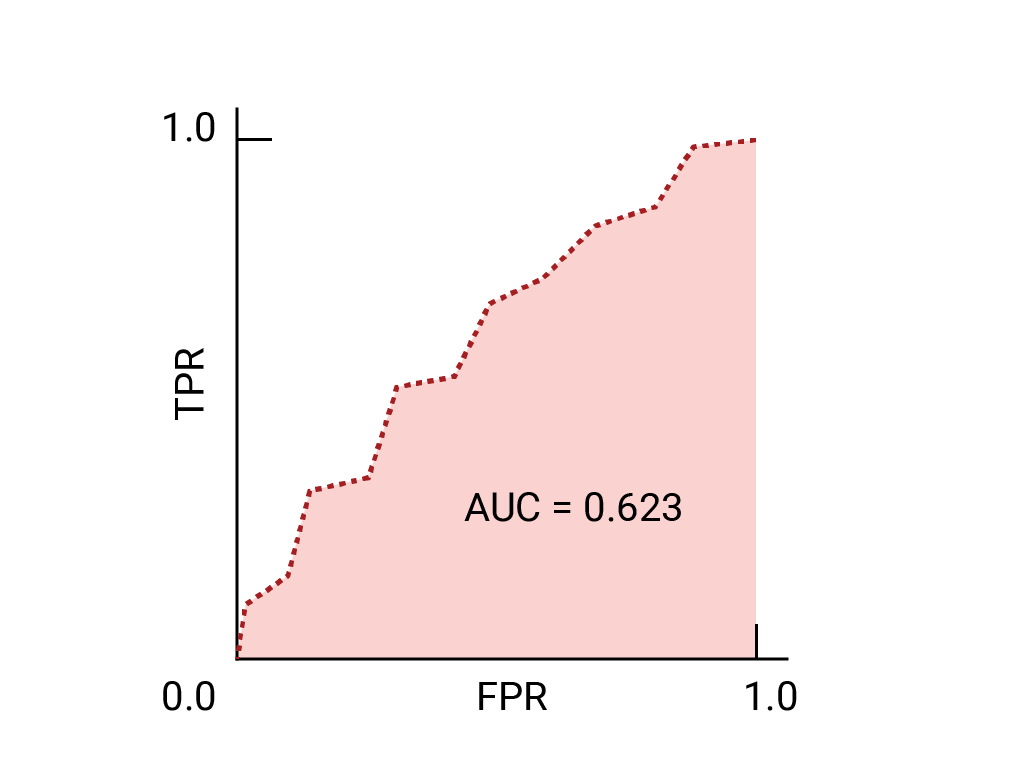
AUC 是比较两个不同模型性能的有效衡量指标,前提是数据集大致平衡。曲线下面积较大的模型通常是更好的模型。
ROC 曲线上最接近 (0,1) 的点表示给定模型效果最佳的阈值范围。如阈值、混淆矩阵和指标选择和权衡部分所述,您选择的阈值取决于哪个指标对特定用例而言最重要。请考虑下图中的点 A、B 和 C,每个点都代表一个阈值:
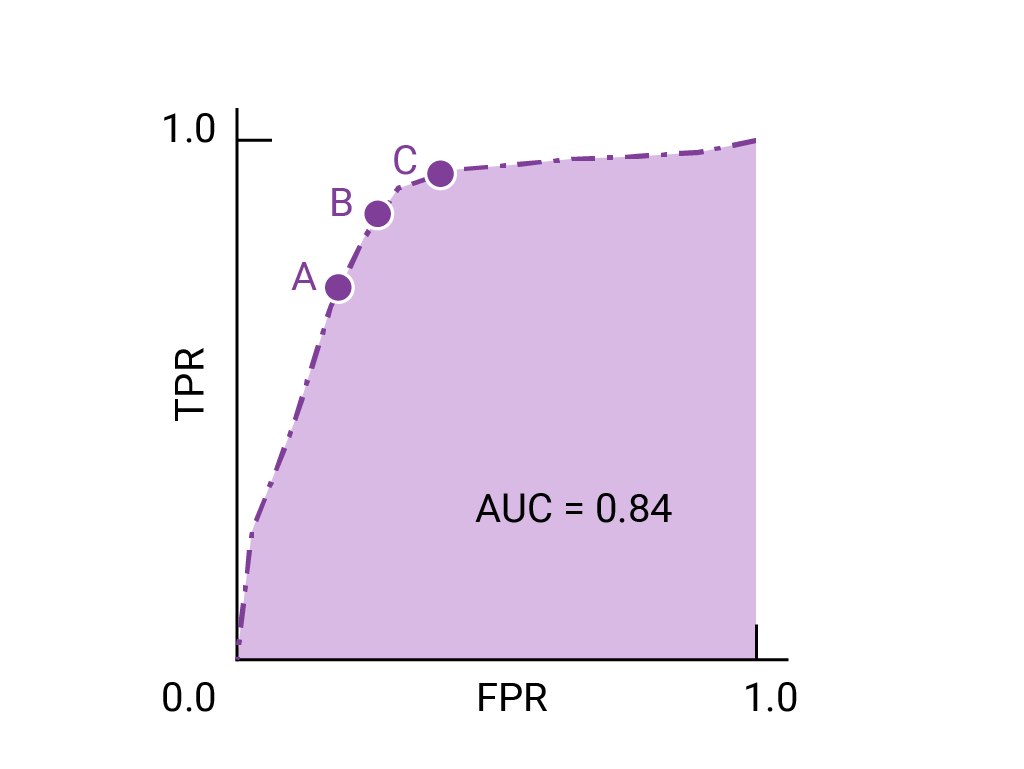
如果假正例(误报)的代价很高,则可能有必要选择 FPR 较低的阈值(例如 A 点),即使 TPR 会降低也是如此。反之,如果假正例成本较低,而假负例(漏掉的真正例)成本较高,则点 C 的阈值(可最大限度地提高 TPR)可能更为合适。如果费用大致相当,点 B 在 TPR 和 FPR 之间可能提供最佳平衡。
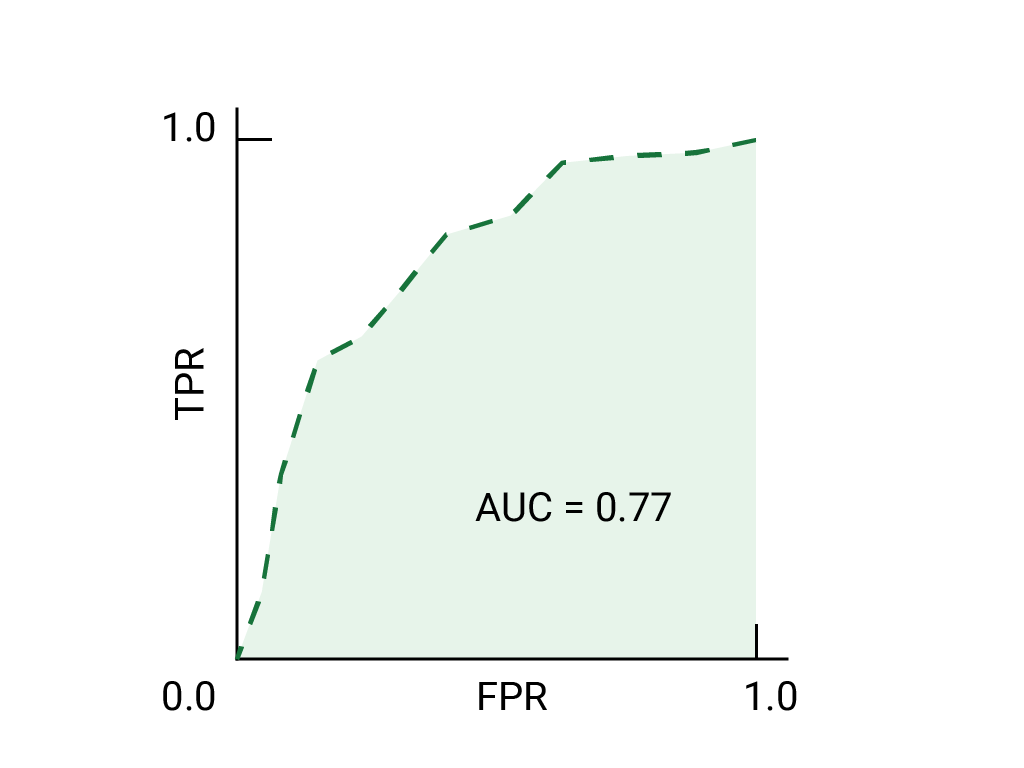
下面是之前所见数据的 ROC 曲线:
练习:检查您的理解情况
(可选、高级)加分题
假设在某种情况下,允许部分垃圾邮件进入收件箱,比将重要的业务电子邮件发送到“垃圾邮件”文件夹要好。您已针对这种情况训练了垃圾邮件分类器,其中正类别为垃圾邮件,负类别为非垃圾邮件。 分类器 ROC 曲线上的以下哪个点更理想?