在评估模型预测的公平性时,我们可以使用的一种方法是 比较多数群体和少数群体的入学率。 如果两个入学率相等,模型的预测结果表明 受众特征对等: 学生被录入大学的几率不会因 受众特征群体。
假设该录取模型接受多数人的 16 位候选人 选出了 4 位来自少数族裔群体的候选人。模型的决策 即多数人和多数人均符合人口统计学特征的接受率, 少数民族候选人占 20%。
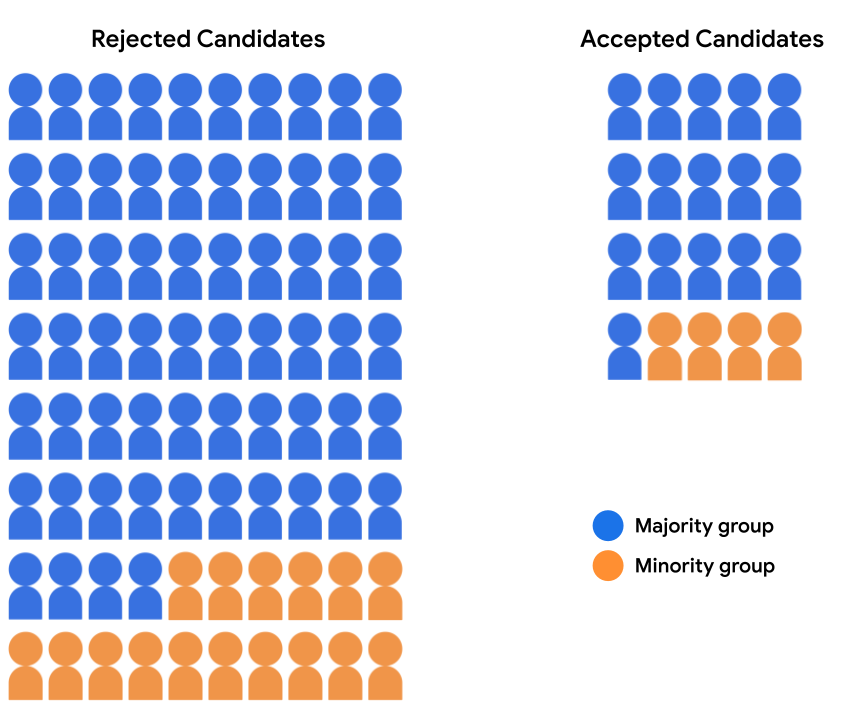
下表量化了支持被拒和已接受的 API 的数字 如图 2 所示。
| 多数派 | 少数群体 | |
|---|---|---|
| 已接受 | 16 | 4 |
| 已拒绝 | 64 | 16 |
| 接受率 | 20% | 20% |
练习:检查您的直觉
大学招生委员会正在考虑使用人口统计学平等 作为模型的公平性评估指标,需要您的指导 介绍这种方法的优缺点你能找出一个吗 优点和使用受众特征评估模型预测结果的一个缺点 对等?
继续阅读下一部分:优势和 缺点。 受众特征对等。
优点和缺点
在我们的招生示例中,人口统计对等的关键优势在于 确保多数人和少数族裔群体都有机会 与候选集中的学生群体的比例相同。 也就是说,如果申请者群体由 80% 的多数党候选人组成 拥有 20% 的少数族裔候选人,受众特征平等可以保证 在入学者中,80% 为多数群体学生,20% 为少数群体 学生。
但是,受众特征对等有一个显著的缺点: 被归类为“合格”的学生而不是“不符合条件”) 评估应如何分配 20 个入场空档。
我们再来看一下上述候选者群的构成。 不过,这次我们不仅按照受众特征群体对候选人进行分类, 还取决于模型是否将每个候选定位设置都打成了“符合条件”或 "unqualified":
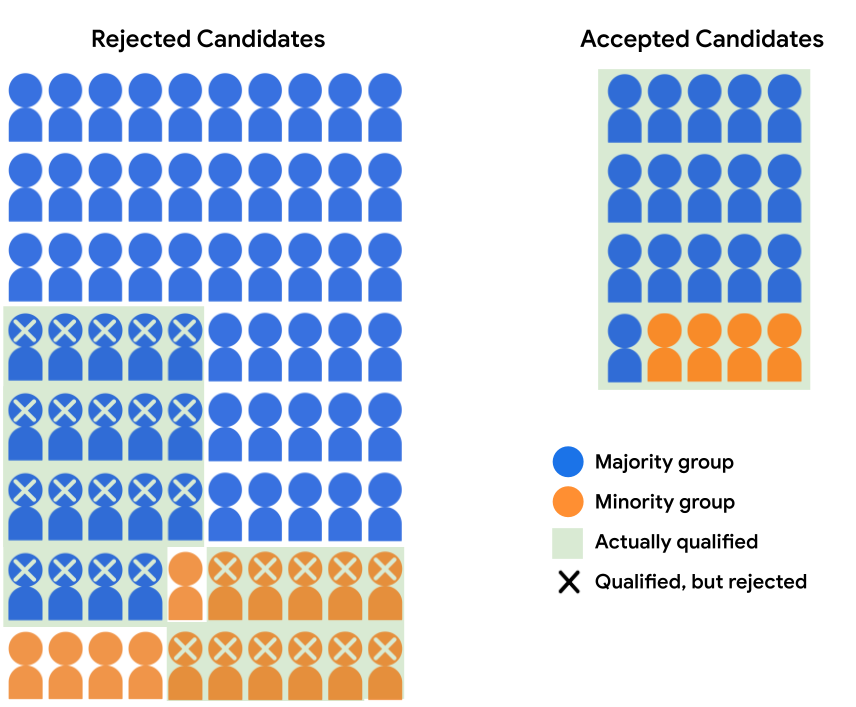
下表量化了支持被拒和已接受的 API 的数字 如图 3 所示。
| 多数派 | 少数群体 | |||
|---|---|---|---|---|
| 已接受 | 已拒绝 | 已接受 | 已拒绝 | |
| 符合条件 | 16 | 19 | 4 | 11 |
| 不符合条件 | 0 | 45 | 0 | 5 |
我们将以下两组数据中符合条件的学生的录取率制成表格:
尽管这两组的总体接受率都是 20%, 符合条件的大多数学生的录取率为 46%, 而符合条件的少数族裔学生的录取率只有 27%。
在这种情况下, (例如“符合条件”)相差很大,因此受众特征对等可能会 不是评估公平性的最佳指标。在未来 我们会介绍另一个公平性指标,即机会平等, ,后者会将这些差异考虑在内。