AI-generated Key Takeaways
-
Equality of opportunity in machine learning focuses on ensuring that qualified individuals have an equal chance of being accepted, regardless of their demographic group.
-
It's achieved when the acceptance rates for qualified individuals are the same across different demographic groups, as illustrated by the example with a 40% acceptance rate for qualified candidates in both the majority and minority groups.
-
While it promotes fairness in specific scenarios, equality of opportunity has limitations, such as its dependence on a clear preferred label and potential challenges in situations lacking demographic data.
-
Unlike demographic parity which focuses on overall acceptance rates, equality of opportunity concentrates on the acceptance rates within the qualified subset of each group.
-
It's possible for a model to satisfy both demographic parity and equality of opportunity simultaneously, under specific conditions where positive prediction rates and true positive rates are balanced across groups.
In the previous section, we evaluated our admissions model for fairness using demographic parity, by comparing the overall acceptance rates for both demographic groups.
Alternatively, we could compare the acceptance rates for just the qualified candidates in the majority group and the minority group. If the acceptance rates for qualified students in both groups are equal, the model exhibits equality of opportunity: students with our preferred label ("qualified for admission") have an equal chance of being admitted, irrespective of which demographic group they belong to.
Let's revisit our candidate pool from the previous section:
| Majority group | Minority group | |
|---|---|---|
| Qualified | 35 | 15 |
| Unqualified | 45 | 5 |
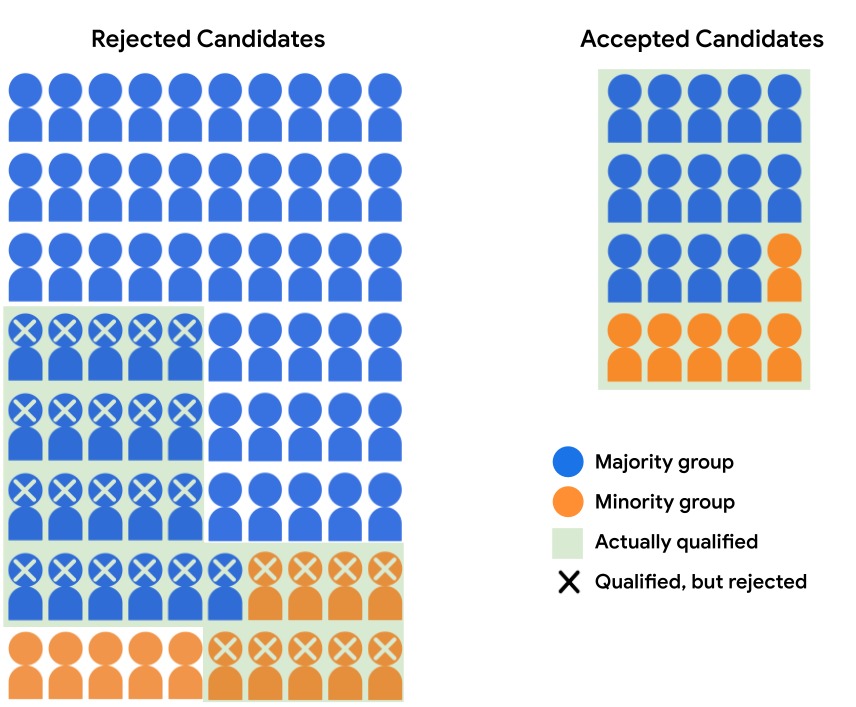
Suppose the admissions model accepts 14 candidates from the majority group and 6 candidates from the minority group. The model's decisions satisfy equality of opportunity, as the acceptance rate for both qualified majority and qualified minority candidates is 40%.

The following table quantifies the numbers supporting the rejected and accepted candidates in Figure 4.
| Majority group | Minority group | |||
|---|---|---|---|---|
| Accepted | Rejected | Accepted | Rejected | |
| Qualified | 14 | 21 | 6 | 9 |
| Unqualified | 0 | 45 | 0 | 5 |
Benefits and Drawbacks
The key benefit of equality of opportunity is that it allows the model's ratio of positive to negative predictions to vary across demographic groups, provided that the model is equally successful at predicting the preferred label ("qualified for admission") for both groups.
The model predictions in Figure 4 do not satisfy demographic parity, as a student in the majority group has a 17.5% chance of being accepted, and a student in the minority group has a 30% chance of being accepted. However, a qualified student has a 40% chance of being accepted, irrespective of which group they belong to, which is arguably an outcome that is more fair in this particular model use case.
One drawback of equality of opportunity is that it is designed for use cases where there is a clear-cut preferred label. If it's equally important that the model predict both the positive class ("qualified for admission") and negative class ("not qualified for admission") for all demographic groups, it may make sense to instead use the metric equalized odds, which enforces equal success rates for both labels.
Another drawback of equality of opportunity is that it assesses fairness
by comparing error rates in aggregate for demographic groups, which may
not always be feasible. For example, if our admissions model's dataset
did not have a feature of demographic_group, it would not be possible to
break out acceptance rates for qualified majority and minority candidates
and compare them to see if equality of opportunity is satisfied.
In the next section, we'll look at another fairness metric, counterfactual fairness, that can be employed in scenarios where demographic data doesn't exist for all examples.
Exercise: Check your understanding
It's possible for a model's predictions to satisfy both demographic parity and equality of opportunity.
For example, let's say a binary classifier (whose preferred label is the positive class) is evaluated on 100 examples, with results shown in the following confusion matrices, broken out by demographic group (majority and minority):
| Majority group | Minority group | |||
|---|---|---|---|---|
| Predicted positive | Predicted negative | Predicted positive | Predicted negative | |
| Actual positive | 6 | 12 | 3 | 6 |
| Actual negative | 10 | 36 | 6 | 21 |
|
\(\text{Positive Rate} = \frac{6+10}{6+10+12+36} = \frac{16}{64} = \text{25%}\) \(\text{True Positive Rate} = \frac{6}{6+12} = \frac{6}{18} = \text{33%}\) |
\(\text{Positive Rate} = \frac{3+6}{3+6+6+21} = \frac{9}{36} = \text{25%}\) \(\text{True Positive Rate} = \frac{3}{3+6} = \frac{3}{9} = \text{33%}\) |
|||
Both majority and minority groups have a positive prediction rate of 25%, satisfying demographic parity, and a true positive rate (percentage of examples with the preferred label that are correctly classified) of 33%, satisfying equality of opportunity.