Page Summary
-
Aggregate model performance metrics like precision, recall, and accuracy can hide biases against minority groups.
-
Fairness in model evaluation involves ensuring equitable outcomes across different demographic groups.
-
This page explores various fairness metrics, including demographic parity, equality of opportunity, and counterfactual fairness, to assess model predictions for bias.
-
Evaluating model predictions with these metrics helps in identifying and mitigating potential biases that can negatively affect minority groups.
-
The goal is to develop models that not only achieve good overall performance but also ensure fair treatment for all individuals, regardless of their demographic background.
When evaluating a model, metrics calculated against an entire test or validation set don't always give an accurate picture of how fair the model is. Great model performance overall for a majority of examples may mask poor performance on a minority subset of examples, which can result in biased model predictions. Using aggregate performance metrics such as precision, recall, and accuracy is not necessarily going to expose these issues.
We can revisit our admissions model and explore some new techniques for how to evaluate its predictions for bias, with fairness in mind.
Suppose the admissions classification model selects 20 students to admit to the university from a pool of 100 candidates, belonging to two demographic groups: the majority group (blue, 80 students) and the minority group (orange, 20 students).
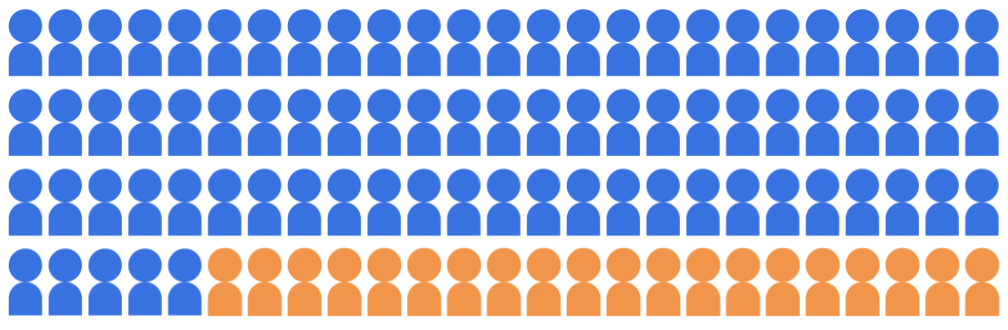
The model must admit qualified students in a manner that is fair to the candidates in both demographic groups.
How should we evaluate the model's predictions for fairness? There are a variety of metrics we can consider, each of which provides a different mathematical definition of "fairness." In the following sections, we'll explore three of these fairness metrics in depth: demographic parity, equality of opportunity, and counterfactual fairness.