모델을 평가할 때 전체 테스트 또는 검증을 기준으로 계산된 측정항목
모델이 얼마나 공정한지에 대한 정확한 그림을 제공하지는 않습니다.
대다수의 예시에서 전반적으로 우수한 모델 성능은 나쁨을 드러낼 수 있습니다.
성능을 평가하여 편향된 결과를 야기할 수 있습니다.
모델 예측에 사용됩니다. 다음과 같은 집계 실적 측정항목을 사용할 경우
정확도,
재현율정확성이 반드시 좋은 것은 아닙니다
사용하여 이러한 문제를
노출할 수 있습니다
입학 모델을 다시 살펴보고 몇 가지 새로운 기법을 살펴볼 수 있습니다.
에서 공정성을 염두에 두고 예측 편향을 평가하는 방법을 알아보세요.
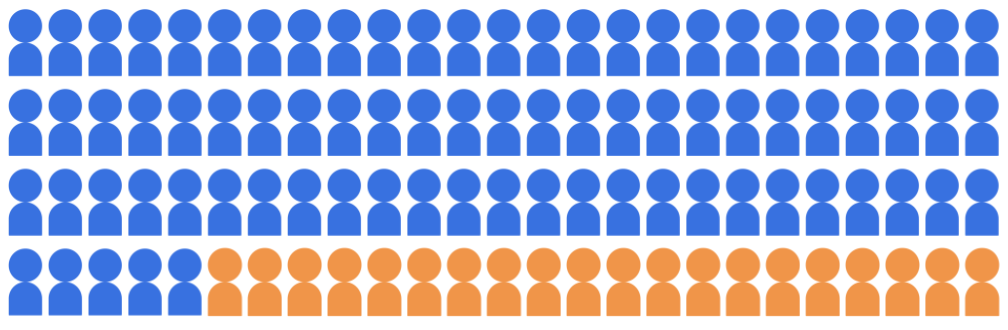
입학 분류 모델이 대학에 입학할 학생 20명을 선택한다고 가정해 보겠습니다.
두 인구통계 그룹에 속하는 100명의 지원자 풀에서 대학을 만들었습니다.
다수 집단 (파란색, 학생 80명)과 소수 집단
(주황색, 학생 20명)
그림 1. 학생 100명으로 구성된 지원자 풀: 학생 80명이 소속
다수 집단 (파란색)과 학생 20명은 소수 집단에 속함
(주황색)
모델은 적격한 학생에 대해 공정한 방식으로
두 인구통계 그룹 모두의 후보자를 예측했습니다.
모델의 예측 공정성을 어떻게 평가해야 할까요? Vertex AI Feature Store에는
측정항목마다 다른 수학적 측정항목을 제공하여
'공정성'의 정의입니다. 다음 섹션에서는
인구통계 동등성, 기회의 균등,
반사실적 공정성입니다.
[null,null,["최종 업데이트: 2024-08-13(UTC)"],[[["\u003cp\u003eAggregate model performance metrics like precision, recall, and accuracy can hide biases against minority groups.\u003c/p\u003e\n"],["\u003cp\u003eFairness in model evaluation involves ensuring equitable outcomes across different demographic groups.\u003c/p\u003e\n"],["\u003cp\u003eThis page explores various fairness metrics, including demographic parity, equality of opportunity, and counterfactual fairness, to assess model predictions for bias.\u003c/p\u003e\n"],["\u003cp\u003eEvaluating model predictions with these metrics helps in identifying and mitigating potential biases that can negatively affect minority groups.\u003c/p\u003e\n"],["\u003cp\u003eThe goal is to develop models that not only achieve good overall performance but also ensure fair treatment for all individuals, regardless of their demographic background.\u003c/p\u003e\n"]]],[],null,["# Fairness: Evaluating for bias\n\nWhen evaluating a model, metrics calculated against an entire test or validation\nset don't always give an accurate picture of how fair the model is.\nGreat model performance overall for a majority of examples may mask poor\nperformance on a minority subset of examples, which can result in biased\nmodel predictions. Using aggregate performance metrics such as\n[**precision**](/machine-learning/glossary#precision),\n[**recall**](/machine-learning/glossary#recall),\nand [**accuracy**](/machine-learning/glossary#accuracy) is not necessarily going\nto expose these issues.\n\nWe can revisit our [admissions model](/machine-learning/crash-course/fairness) and explore some new techniques\nfor how to evaluate its predictions for bias, with fairness in mind.\n\nSuppose the admissions classification model selects 20 students to admit to the\nuniversity from a pool of 100 candidates, belonging to two demographic groups:\nthe majority group (blue, 80 students) and the minority group\n(orange, 20 students).\n**Figure 1.** Candidate pool of 100 students: 80 students belong to the majority group (blue), and 20 students belong to the minority group (orange).\n\nThe model must admit qualified students in a manner that is fair to the\ncandidates in both demographic groups.\n\nHow should we evaluate the model's predictions for fairness? There are a variety\nof metrics we can consider, each of which provides a different mathematical\ndefinition of \"fairness.\" In the following sections, we'll explore three of\nthese fairness metrics in depth: demographic parity, equality of opportunity,\nand counterfactual fairness.\n| **Key terms:**\n|\n| - [Accuracy](/machine-learning/glossary#accuracy)\n| - [Bias (ethics/fairness)](/machine-learning/glossary#bias-ethicsfairness)\n| - [Precision](/machine-learning/glossary#precision)\n- [Recall](/machine-learning/glossary#recall) \n[Help Center](https://support.google.com/machinelearningeducation)"]]