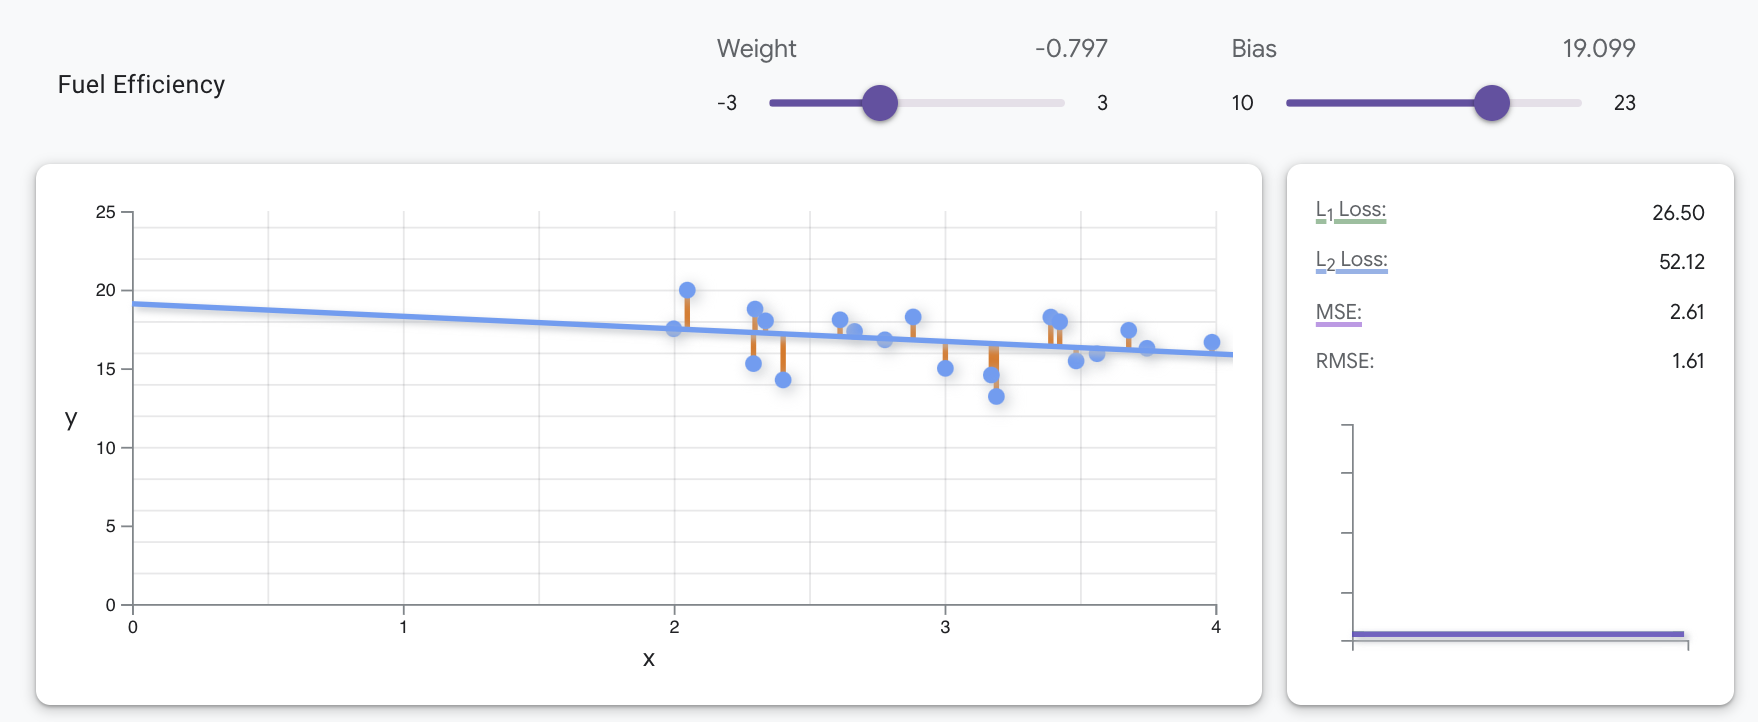
The graph below plots 20 examples from a fuel-efficiency dataset, with the feature (car heaviness in thousands of pounds) plotted on the x-axis and the label (miles per gallon) plotted on the y-axis.
Your task: Adjust the Weight and Bias sliders above the graph to find the linear model that minimizes MSE loss on the data.
Questions to consider:
- What is the lowest MSE you can achieve?
- What weight and bias values produced this loss?
Click the plus icon to see the solution
The optimal linear model for this data has an MSE of 3.37, with a weight of –0.12 and a bias of 16.96, as shown in the following image.