线性回归:参数练习
使用集合让一切井井有条
根据您的偏好保存内容并对其进行分类。
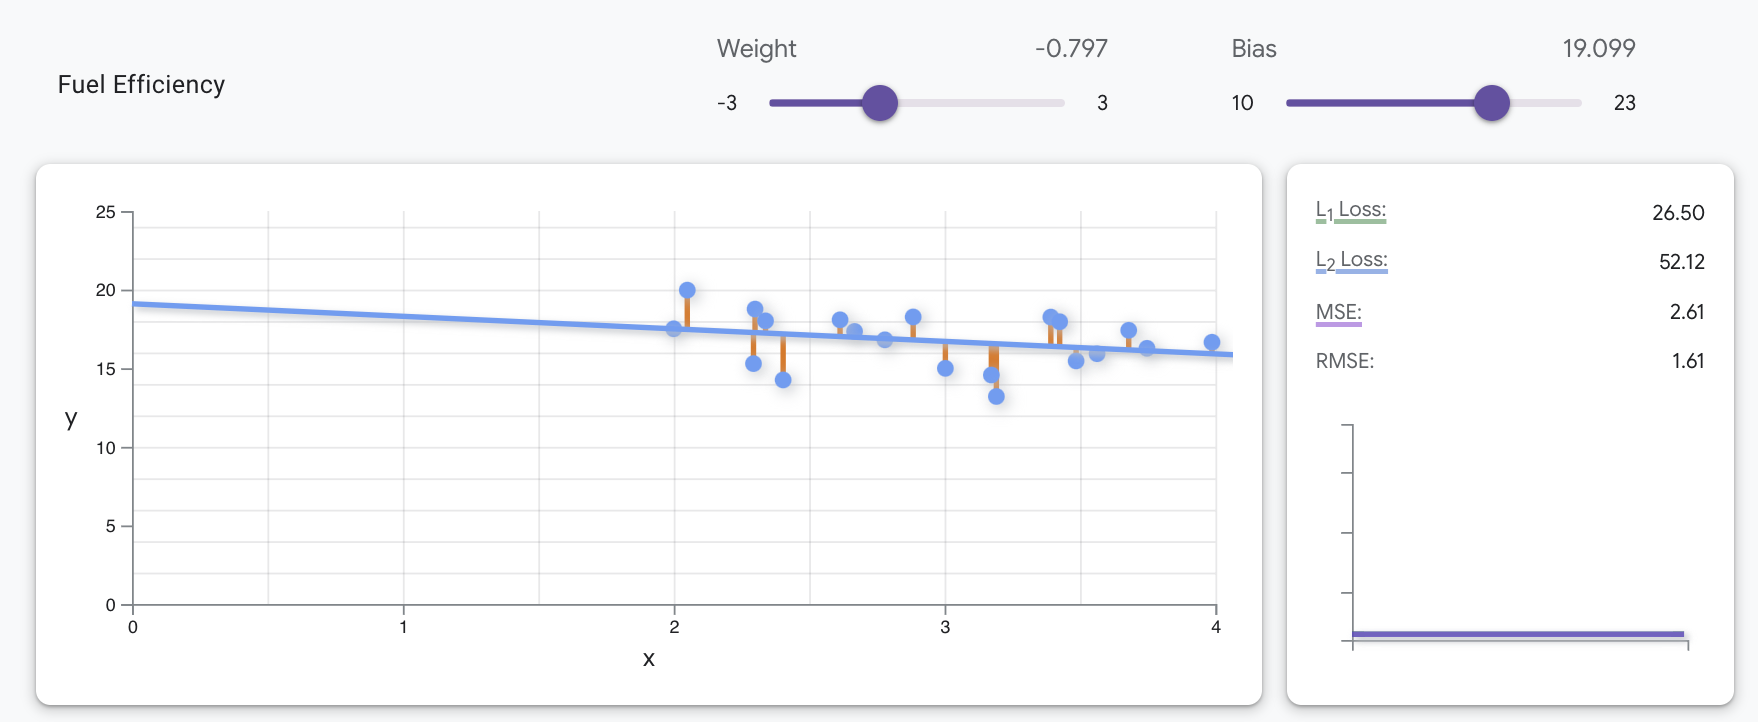
下图绘制了燃油效率数据集中的 20 个示例,其中 x 轴表示特征(汽车重量,单位为千磅),y 轴表示标签(每加仑行驶里程数)。
您的任务:调整图表上方的权重和偏差滑块,找到可最大限度减少数据 MSE 损失的线性模型。
需要考虑的问题:
- 您可以实现的最低 MSE 是多少?
- 哪些权重和偏差值产生了此损失?
点击加号图标即可查看解决方案
此数据的最佳线性模型的 MSE 为 3.37,权重为 -0.12,偏差为 16.96,如下图所示。
如未另行说明,那么本页面中的内容已根据知识共享署名 4.0 许可获得了许可,并且代码示例已根据 Apache 2.0 许可获得了许可。有关详情,请参阅 Google 开发者网站政策。Java 是 Oracle 和/或其关联公司的注册商标。
最后更新时间 (UTC):2025-07-09。
[null,null,["最后更新时间 (UTC):2025-07-09。"],[],[],null,["# Linear regression: Parameters exercise\n\nThe graph below plots 20 examples from a fuel-efficiency dataset, with the\nfeature (car heaviness in thousands of pounds) plotted on the x-axis and the\nlabel (miles per gallon) plotted on the y-axis.\n\n**Your task:** Adjust the **Weight** and **Bias** sliders above the graph to\nfind the linear model that minimizes MSE loss on the data.\n\n**Questions to consider:**\n\n- What is the lowest MSE you can achieve?\n- What weight and bias values produced this loss?\n\n#### Click the plus icon to see the solution\n\nThe optimal linear model for this data has an MSE of 3.37, with a\nweight of --0.12 and a bias of 16.96, as shown in the following image."]]