선형 회귀: 매개변수 연습
컬렉션을 사용해 정리하기
내 환경설정을 기준으로 콘텐츠를 저장하고 분류하세요.
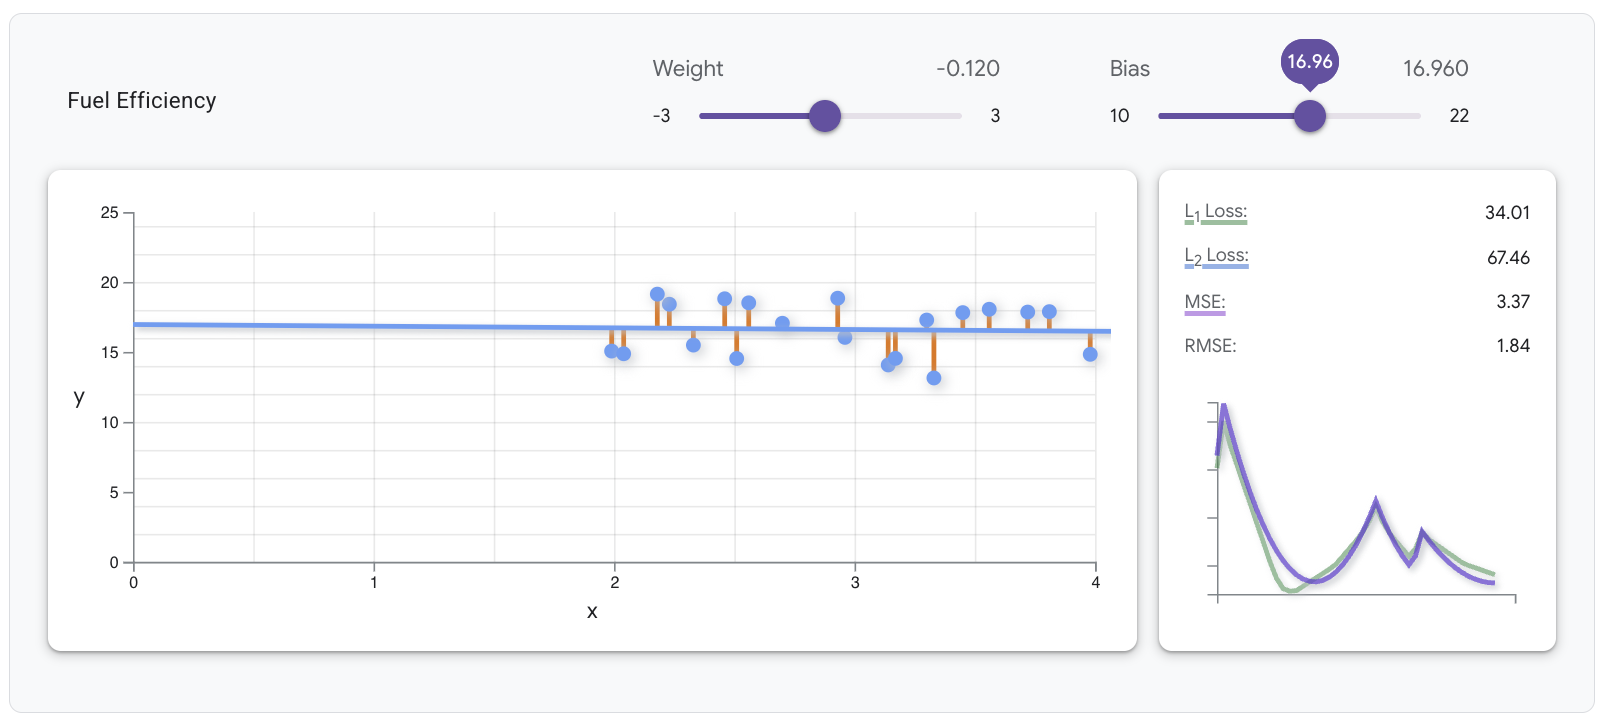
아래 그래프는 연비 데이터 세트의 20개 예를 보여줍니다. 특성(자동차 무게(파운드 단위))은 x축에 표시되고 라벨(갤런당 마일)은 y축에 표시됩니다.
과제: 그래프 위의 가중치 및 편향 슬라이더를 조정하여 데이터의 MSE 손실을 최소화하는 선형 모델을 찾습니다.
고려해 볼 만한 사항:
- 달성할 수 있는 가장 낮은 MSE는 무엇인가요?
- 어떤 가중치와 편향 값이 이 손실을 발생시켰나요?
더하기 아이콘을 클릭하여 솔루션을 확인하세요.
이 데이터의 최적 선형 모델은 다음 이미지와 같이 가중치 -0.12, 편향 16.96으로 MSE가 3.37입니다.
달리 명시되지 않는 한 이 페이지의 콘텐츠에는 Creative Commons Attribution 4.0 라이선스에 따라 라이선스가 부여되며, 코드 샘플에는 Apache 2.0 라이선스에 따라 라이선스가 부여됩니다. 자세한 내용은 Google Developers 사이트 정책을 참조하세요. 자바는 Oracle 및/또는 Oracle 계열사의 등록 상표입니다.
최종 업데이트: 2025-07-09(UTC)
[null,null,["최종 업데이트: 2025-07-09(UTC)"],[],[],null,["# Linear regression: Parameters exercise\n\nThe graph below plots 20 examples from a fuel-efficiency dataset, with the\nfeature (car heaviness in thousands of pounds) plotted on the x-axis and the\nlabel (miles per gallon) plotted on the y-axis.\n\n**Your task:** Adjust the **Weight** and **Bias** sliders above the graph to\nfind the linear model that minimizes MSE loss on the data.\n\n**Questions to consider:**\n\n- What is the lowest MSE you can achieve?\n- What weight and bias values produced this loss?\n\n#### Click the plus icon to see the solution\n\nThe optimal linear model for this data has an MSE of 3.37, with a\nweight of --0.12 and a bias of 16.96, as shown in the following image."]]