線形回帰: パラメータ演習
コレクションでコンテンツを整理
必要に応じて、コンテンツの保存と分類を行います。
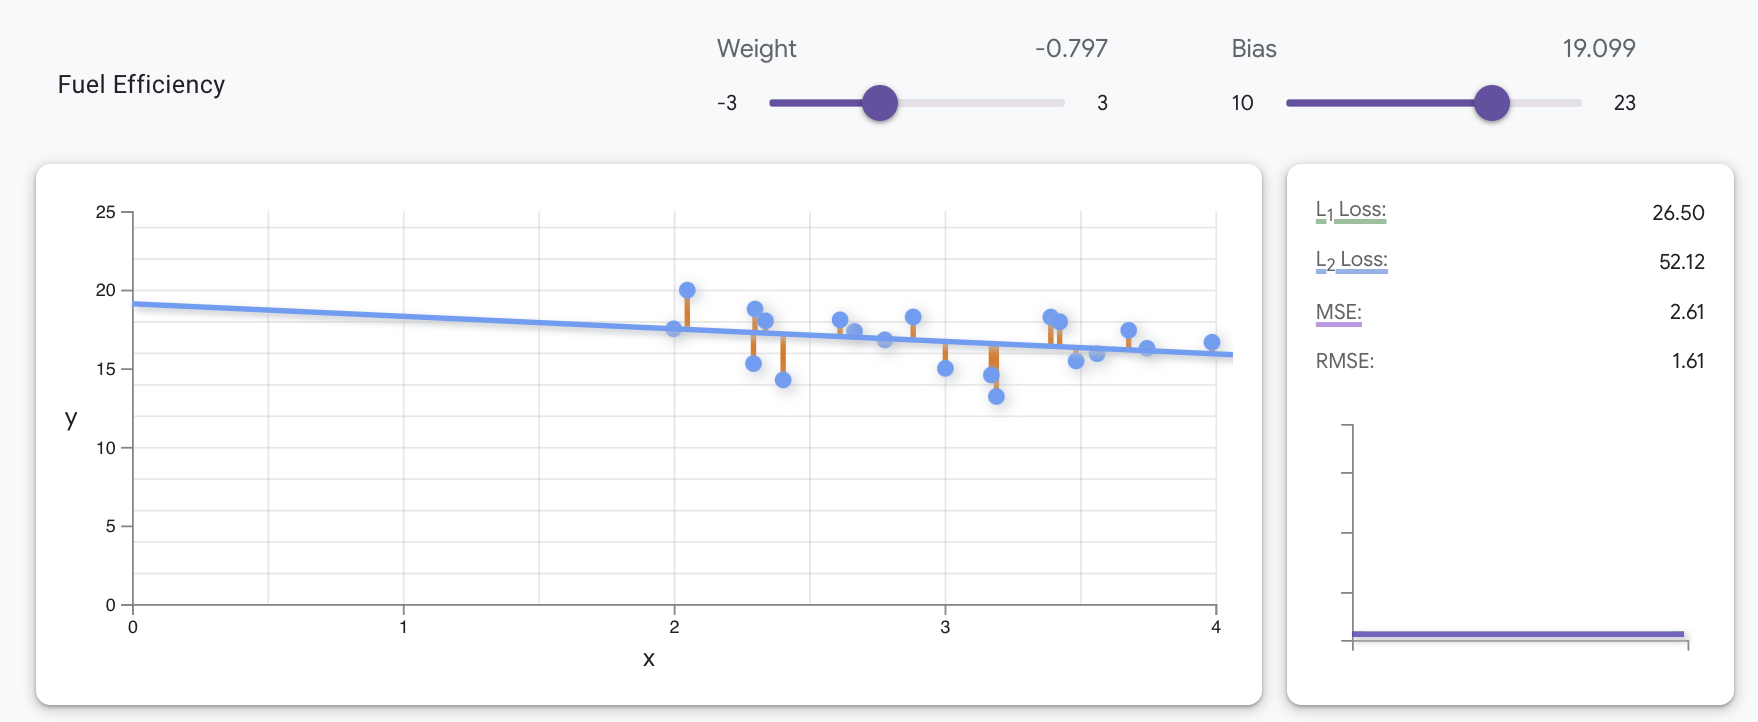
下のグラフは、燃費データセットの 20 個の例をプロットしたものです。特徴量(車の重量(千ポンド単位))は x 軸にプロットされ、ラベル(ガロンあたりの走行距離)は y 軸にプロットされています。
タスク: グラフの上にある [重み] スライダーと [バイアス] スライダーを調整して、データの MSE 損失を最小限に抑える線形モデルを見つけます。
検討事項:
- 達成可能な最小の MSE はいくつですか?
- この損失を生み出した重みとバイアスの値は何ですか?
プラスアイコンをクリックして解決策を表示します。
このデータの最適な線形モデルの MSE は 3.37 で、重みは -0.12、バイアスは 16.96 です(次の図を参照)。
特に記載のない限り、このページのコンテンツはクリエイティブ・コモンズの表示 4.0 ライセンスにより使用許諾されます。コードサンプルは Apache 2.0 ライセンスにより使用許諾されます。詳しくは、Google Developers サイトのポリシーをご覧ください。Java は Oracle および関連会社の登録商標です。
最終更新日 2025-07-09 UTC。
[null,null,["最終更新日 2025-07-09 UTC。"],[],[],null,["# Linear regression: Parameters exercise\n\nThe graph below plots 20 examples from a fuel-efficiency dataset, with the\nfeature (car heaviness in thousands of pounds) plotted on the x-axis and the\nlabel (miles per gallon) plotted on the y-axis.\n\n**Your task:** Adjust the **Weight** and **Bias** sliders above the graph to\nfind the linear model that minimizes MSE loss on the data.\n\n**Questions to consider:**\n\n- What is the lowest MSE you can achieve?\n- What weight and bias values produced this loss?\n\n#### Click the plus icon to see the solution\n\nThe optimal linear model for this data has an MSE of 3.37, with a\nweight of --0.12 and a bias of 16.96, as shown in the following image."]]