이 모듈에서는 로지스틱 회귀 모델 출력을 그대로 사용하는 것에 중점을 둡니다. 분류 모듈에서는 이 출력을 바이너리 카테고리로 변환하는 방법을 알아봅니다.
시그모이드 함수
로지스틱 회귀 모델에서 어떻게 출력이 확률을 나타내고 항상 0과 1 사이의 값을 출력할 수 있는지 궁금할 수 있습니다. 마침 로지스틱 함수라는 함수 계열이 있는데 이 함수의 출력에 동일한 특성이 있습니다. 표준 로지스틱 함수(시그모이드 함수라고도 하며 시그모이드는 's자 모양'을 의미함)의 수식은 다음과 같습니다.
\[f(x) = \frac{1}{1 + e^{-x}}\]
그림 1은 이에 상응하는 시그모이드 함수의 그래프를 보여줍니다.
그림 1. 시그모이드 함수 그래프. 곡선은 x값이 음의 무한대로 감소할수록 0에 가까워지고, x값이 무한대로 증가할수록 1에 가까워집니다.
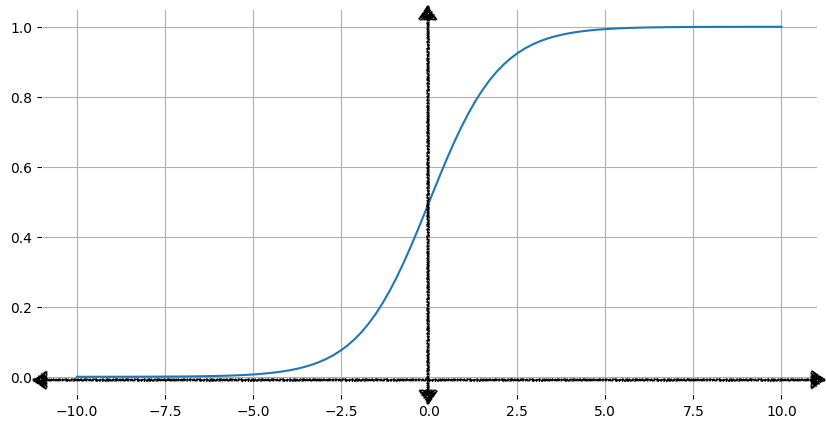
입력값 x가 증가할수록 시그모이드 함수의 출력값은 1에 가까워지지만, 도달하지는 않습니다. 마찬가지로 입력값이 감소할수록 시그모이드 함수의 출력값은 0에 가까워지지만 도달하지는 않습니다.
여기를 클릭하여 시그모이드 함수의 수학에 관해 자세히 알아보기
아래 표는 -7~7 범위의 입력값에 대한 시그모이드 함수의 출력값을 보여줍니다. 음의 입력값이 감소할 때 시그모이드가 0에 얼마나 빨리 가까워지는지, 양의 입력값이 증가할 때 시그모이드가 얼마나 빨리 1에 가까워지는지 확인해 보세요.
로지스틱 회귀 예측을 얻기 위해 다음과 같이 z값이 시그모이드 함수로 전달되어 0과 1 사이의 값(확률)이 생성됩니다.
\[y' = \frac{1}{1 + e^{-z}}\]
각 항목의 의미는 다음과 같습니다.
y'는 로지스틱 회귀 모델의 출력입니다.
z는 선형 출력입니다(위 방정식에서 계산됨).
여기를 클릭하여 로그 오즈에 대해 자세히 알아보기
$z = b + w_1x_1 + w_2x_2 + \ldots + w_Nx_N$ 방정식에서 z는 로그 오즈라고 합니다. 아래 시그모이드 함수(여기서 $y$는 로지스틱 회귀 모델의 출력이며 확률을 나타냄)로 시작하기 때문입니다.
$$y = \frac{1}{1 + e^{-z}}$$
그런 다음 z를 구합니다.
$$ z = \log\left(\frac{y}{1-y}\right) $$
그러면 z는 두 가지 가능한 결과인 y와 1 – y의 확률 비율의 로그로 정의됩니다.
그림 2는 다음 계산을 사용하여 선형 출력이 로지스틱 회귀 출력으로 변환되는 방식을 보여줍니다.
그림 2. 왼쪽: 세 점이 강조 표시된 선형 함수 z = 2x + 5의 그래프. 오른쪽: 시그모이드 함수로 변환된 동일한 세 점이 강조 표시된 시그모이드 곡선
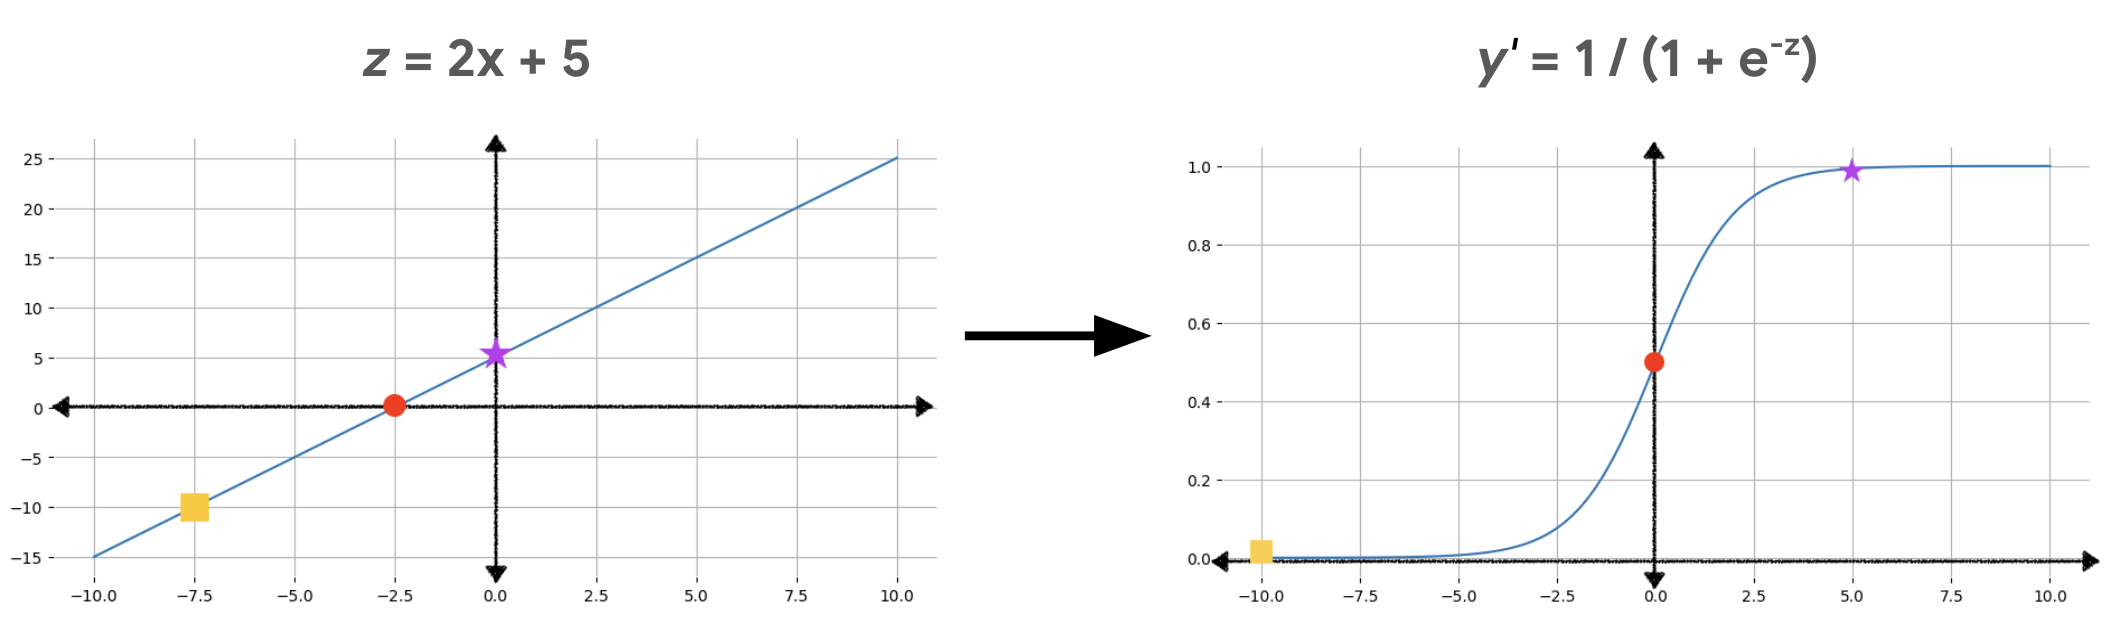
그림 2에서 선형 방정식은 시그모이드 함수의 입력이 되므로 직선이 s자 모양으로 구부러집니다. 선형 방정식은 매우 크거나 매우 작은 z값을 출력할 수 있지만, 시그모이드 함수 출력인 y'는 항상 0보다 크고 1보다 작은 값입니다. 예를 들어 왼쪽 그래프의 노란색 사각형은 z값이 –10이지만 오른쪽 그래프의 시그모이드 함수에서는 –10을 0.00004라는 y'값에 매핑합니다.
[null,null,["최종 업데이트: 2025-01-09(UTC)"],[[["\u003cp\u003eLogistic regression models output probabilities, which can be used directly or converted to binary categories.\u003c/p\u003e\n"],["\u003cp\u003eThe sigmoid function ensures the output of logistic regression is always between 0 and 1, representing a probability.\u003c/p\u003e\n"],["\u003cp\u003eA logistic regression model uses a linear equation and the sigmoid function to calculate the probability of an event.\u003c/p\u003e\n"],["\u003cp\u003eThe log-odds (z) represent the log of the ratio of probabilities for the two possible outcomes.\u003c/p\u003e\n"]]],[],null,["# Logistic regression: Calculating a probability with the sigmoid function\n\nMany problems require a probability estimate as output.\n[**Logistic regression**](/machine-learning/glossary#logistic_regression) is\nan extremely efficient mechanism for calculating probabilities. Practically\nspeaking, you can use the returned probability in either of the following\ntwo ways:\n\n- Applied \"as is.\" For example, if a spam-prediction model takes an email as\n input and outputs a value of `0.932`, this implies a `93.2%` probability that\n the email is spam.\n\n- Converted to a [**binary category**](/machine-learning/glossary#binary-classification)\n such as `True` or `False`, `Spam` or `Not Spam`.\n\nThis module focuses on using logistic regression model output as-is. In the\n[Classification module](../classification/index.md), you'll learn how to\nconvert this output into a binary category.\n\nSigmoid function\n----------------\n\nYou might be wondering how a logistic regression model can ensure its output\nrepresents a probability, always outputting a value between 0 and 1. As it\nhappens, there's a family of functions called **logistic functions**\nwhose output has those same characteristics. The standard logistic function,\nalso known as the\n[**sigmoid function**](/machine-learning/glossary#sigmoid-function)\n(*sigmoid* means \"s-shaped\"), has the\nformula:\n\n\\\\\\[f(x) = \\\\frac{1}{1 + e\\^{-x}}\\\\\\]\n\nFigure 1 shows the corresponding graph of the sigmoid function.\n**Figure 1.** Graph of the sigmoid function. The curve approaches 0 as *x* values decrease to negative infinity, and 1 as *x* values increase toward infinity.\n\nAs the input, `x`, increases, the output of the sigmoid function approaches\nbut never reaches `1`. Similarly, as the input decreases, the sigmoid\nfunction's output approaches but never reaches `0`. \n**Click here for a deeper dive into the math\nbehind the sigmoid function**\n\nThe table below shows the output values of the sigmoid function for\ninput values in the range --7 to 7. Note how quickly the sigmoid approaches\n0 for decreasing negative input values, and how quickly the sigmoid approaches\n1 for increasing positive input values.\n\nHowever, no matter how large or how small the input value, the output will\nalways be greater than 0 and less than 1.\n\n| Input | Sigmoid output |\n|-------|----------------|\n| -7 | 0.001 |\n| -6 | 0.002 |\n| -5 | 0.007 |\n| -4 | 0.018 |\n| -3 | 0.047 |\n| -2 | 0.119 |\n| -1 | 0.269 |\n| 0 | 0.50 |\n| 1 | 0.731 |\n| 2 | 0.881 |\n| 3 | 0.952 |\n| 4 | 0.982 |\n| 5 | 0.993 |\n| 6 | 0.997 |\n| 7 | 0.999 |\n\n### Transforming linear output using the sigmoid function\n\nThe following equation represents the linear component of a logistic\nregression model:\n\n\\\\\\[z = b + w_1x_1 + w_2x_2 + \\\\ldots + w_Nx_N\\\\\\]\n\nwhere:\n\n- *z* is the output of the linear equation, also called the [**log odds**](/machine-learning/glossary#log-odds).\n- *b* is the bias.\n- The *w* values are the model's learned weights.\n- The *x* values are the feature values for a particular example.\n\nTo obtain the logistic regression prediction, the *z* value is then passed to\nthe sigmoid function, yielding a value (a probability) between 0 and 1:\n\n\\\\\\[y' = \\\\frac{1}{1 + e\\^{-z}}\\\\\\]\n\nwhere:\n\n- *y'* is the output of the logistic regression model.\n- *z* is the linear output (as calculated in the preceding equation).\n\n**Click here to learn more about\nlog-odds**\n\nIn the equation $z = b + w_1x_1 + w_2x_2 + \\\\ldots + w_Nx_N$, *z*\nis referred to as the *log-odds* because if you start with the\nfollowing sigmoid function (where $y$ is the output of a logistic\nregression model, representing a probability):\n\n$$y = \\\\frac{1}{1 + e\\^{-z}}$$\n\nAnd then solve for *z*:\n\n$$ z = \\\\log\\\\left(\\\\frac{y}{1-y}\\\\right) $$\n\nThen *z* is defined as the log of the ratio of the probabilities\nof the two possible outcomes: *y* and *1 -- y*.\n\nFigure 2 illustrates how linear output is transformed to logistic regression\noutput using these calculations.\n**Figure 2.** Left: graph of the linear function z = 2x + 5, with three points highlighted. Right: Sigmoid curve with the same three points highlighted after being transformed by the sigmoid function.\n\nIn Figure 2, a linear equation becomes input to the sigmoid function,\nwhich bends the straight line into an s-shape. Notice that the linear equation\ncan output very big or very small values of z, but the output of the sigmoid\nfunction, y', is always between 0 and 1, exclusive. For example, the yellow\nsquare on the left graph has a z value of --10, but the sigmoid function in the\nright graph maps that --10 into a y' value of 0.00004.\n\nExercise: Check your understanding\n----------------------------------\n\nA logistic regression model with three features has the following bias and\nweights:\n\n\\\\\\[\\\\begin{align}\nb \\&= 1 \\\\\\\\\nw_1 \\&= 2 \\\\\\\\\nw_2 \\&= -1 \\\\\\\\\nw_3 \\&= 5\n\\\\end{align}\n\\\\\\]\n\nGiven the following input values:\n\n\\\\\\[\\\\begin{align}\nx_1 \\&= 0 \\\\\\\\\nx_2 \\&= 10 \\\\\\\\\nx_3 \\&= 2\n\\\\end{align}\n\\\\\\]\n\nAnswer the following two questions. \n1. What is the value of *z* for these input values? \n--1 \n0 \n0.731 \n1 \nCorrect! The linear equation defined by the weights and bias is *z* = 1 + 2x~1~ -- x~2~ + 5 x~3~. Plugging the input values into the equation produces z = 1 + (2)(0) - (10) + (5)(2) = 1 2. What is the logistic regression prediction for these input values? \n0.268 \n0.5 \n0.731 \nAs calculated in #1 above, the log-odds for the input values is 1.\nPlugging that value for *z* into the sigmoid function:\n\n\\\\(y = \\\\frac{1}{1 + e\\^{-z}} = \\\\frac{1}{1 + e\\^{-1}} = \\\\frac{1}{1 + 0.367} = \\\\frac{1}{1.367} = 0.731\\\\) \n1 \nRemember, the output of the sigmoid function will always be greater than 0 and less than 1.\n| **Key terms:**\n|\n| - [Binary classification](/machine-learning/glossary#binary-classification)\n| - [Log odds](/machine-learning/glossary#log-odds)\n| - [Logistic regression](/machine-learning/glossary#logistic_regression)\n- [Sigmoid function](/machine-learning/glossary#sigmoid-function) \n[Help Center](https://support.google.com/machinelearningeducation)"]]