עצי תפוחים מניבים תערובת של פירות מתוקים וקטלניים. אבל התפוחים בחנויות מכולת יוקרתיות מציגים פירות מושלמים ב-100%. בין המטע למצרכים, מישהו מבלה זמן רב בהסרת מוצרים את התפוחים הגרועים או לרסס קצת שעווה על התפוחים שניתן להציל. כמהנדסי למידת מכונה תשקיעו כמויות עצומות של זמנכם להשליך דוגמאות רעות ולנקות את הדוגמאות הבעייתיות. גם כמה תפוחים גרועים יכולים להרוס מערך נתונים גדול.
הרבה דוגמאות במערכי נתונים הן לא אמינות בגלל אחד או יותר את הבעיות הבאות:
| קטגוריית הבעיה | דוגמה |
|---|---|
| ערכים שהושמטו | אדם שמבצע מפקד אוכלוסין לא מתעד את גילו של התושב. |
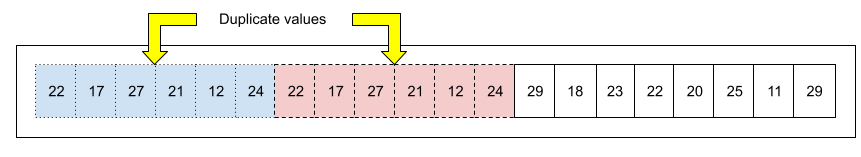
| דוגמאות כפולות | שרת מעלה את אותם יומנים פעמיים. |
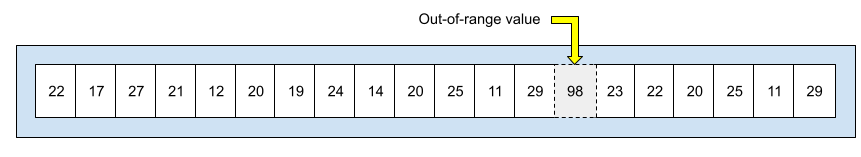
| ערכי התכונות מחוץ לטווח. | בן אדם מקליד בטעות ספרה נוספת. |
| תוויות שגויות | מעריך אנושי מסמן בטעות תמונה של עץ אלון מייפל. |
תוכלו לכתוב תוכנה או סקריפט כדי לזהות כל אחת מהבעיות הבאות:
- ערכים שהושמטו
- דוגמאות כפולות
- ערכי תכונות מחוץ לטווח
לדוגמה, מערך הנתונים הבא מכיל שישה ערכים חוזרים:
דוגמה נוספת, נניח שטווח הטמפרטורות של תכונה מסוימת בין 10 ל-30 מעלות, כולל. אבל תאונות קורות. המדחום חשוף זמנית לשמש, מה שגורם לחריג חשוד טעות. על התוכנית או הסקריפט שלך לזהות ערכי טמפרטורה נמוכים מ-10 ומעלה מ-30:
כשתוויות נוצרות על ידי כמה אנשים, מומלץ מבחינה סטטיסטית כדי לקבוע אם כל המדרג יצר קבוצות שוות ערך של תוויות. אולי אחד מהמדרגים היה גבוה יותר מהמדרגים האחרים, או השתמש בהם קבוצה שונה של קריטריונים למתן ציונים?
לאחר הזיהוי, בדרך כלל "תיקון" דוגמאות שכוללות תכונות מזיקות או תוויות שגויות על ידי הסרתם ממערך הנתונים או הקצאת הערכים שלהם. פרטים נוספים זמינים במאמר מאפייני הנתונים בקטע של מערכי נתונים, הכללה והתאמת יתר של מודל טרנספורמר.