- Dataset-Verfügbarkeit
- 2000-01-01T00:00:00Z–2020-01-01T00:00:00Z
- Dataset-Anbieter
- NASA SEDAC am Center for International Earth Science Information Network
- Tags
- >
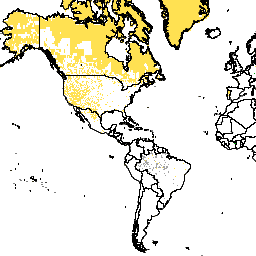
Beschreibung
Dieses Dataset enthält die durchschnittliche Fläche der Eingabeeinheit(en), aus denen Raster für Bevölkerungszahl und ‑dichte erstellt werden.
Die Gridded Population of the World Version 4 (GPWv4), Revision 11, modelliert die Verteilung der globalen Bevölkerung für die Jahre 2000, 2005, 2010, 2015 und 2020 in Rasterzellen mit einer Größe von 30 Bogensekunden (ca. 1 km). Die Bevölkerung wird auf Zellen verteilt, indem die Bevölkerung aus Volkszählungs- und Verwaltungseinheiten proportional zugewiesen wird. Die Bevölkerungsdaten werden mit der detailliertesten räumlichen Auflösung erfasst, die aus den Ergebnissen der Volkszählungen von 2010 (zwischen 2005 und 2014) verfügbar ist. Die Eingabedaten werden extrapoliert, um Bevölkerungsschätzungen für jedes modellierte Jahr zu erstellen.
Bänder
Pixelgröße
927,67 Meter
Bänder
| Name | Min. | Max. | Pixelgröße | Beschreibung |
|---|---|---|---|---|
mean_administrative_unit_area |
0* | 767642* | Meter | Zeigt eine quantitative Fläche an, die die Größe der Eingabeeinheiten in Quadratkilometern angibt, aus denen die Raster für Bevölkerungszahl und ‑dichte abgeleitet werden. |
Nutzungsbedingungen
Nutzungsbedingungen
Zitate
Center for International Earth Science Information Network (CIESIN), Columbia University. 2016. Gridded Population of the World, Version 4 (GPWv4): Mean Administrative Unit Area, Revision 11. Palisades, NY: NASA Socioeconomic Data and Applications Center (SEDAC). https://doi.org/10.7927/H42Z13KG. Zugriff am DAY. MONTH. YEAR.
DOIs
Earth Engine nutzen
Code-Editor (JavaScript)
var dataset = ee.ImageCollection('CIESIN/GPWv411/GPW_Mean_Administrative_Unit_Area');
var raster = dataset.select('mean_administrative_unit_area');
var raster_vis = {
  'min': 0.0,
  'palette': [
    'ffffff',
    '747474',
    '656565',
    '3c3c3c',
    '2f2f2f',
    '000000'
  ],
  'max': 40000.0
};
Map.setCenter(-88.6, 26.4, 1);
Map.addLayer(raster, raster_vis, 'mean_administrative_unit_area');