지금까지 공정성 측정항목에 대한 논의는 학습이
테스트 예제에는 인구통계에 대한 포괄적인 인구통계 데이터가 포함되어 있습니다.
하위 그룹이 있습니다. 하지만 그렇지 않은 경우가 많습니다.
입학 데이터 세트에 완전한 인구통계 데이터가 포함되어 있지 않다고 가정해 보겠습니다.
대신 일부 인구통계 그룹 멤버십은
자신이 속한 그룹을 스스로 밝히기로 선택한 학생 등 예
볼 수 있습니다 이 경우 지원자 풀을 허용됨으로 분류하여
그러면 다음과 같이 표시됩니다.
그림 5. 인구통계 그룹 멤버십이 있는 후보자 풀
거의 모든 후보에게 알려지지 않음 (회색으로 음영 처리된 아이콘).
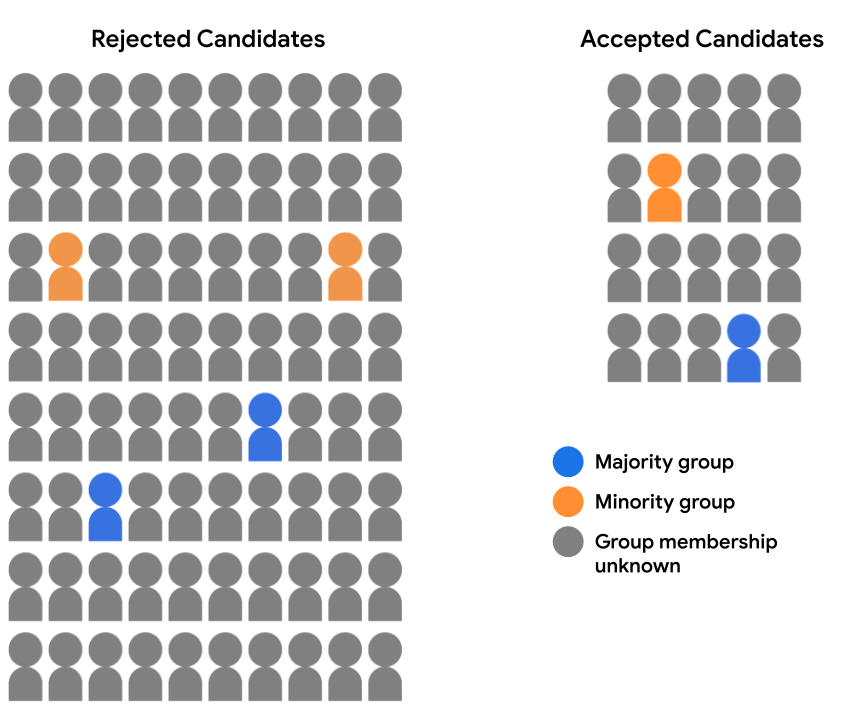
두 인구통계에 대한 모델 예측을 평가하는 것은 불가능합니다.
인구통계 데이터가 없기 때문에 기회의 동등성 또는 기회의 균등
94% 에 이르렀습니다 그러나
개별 예측값의 쌍을 비교할 수 있으므로
과반수 후보자 대다수의 후보자를 비교하여
모델에 의해 공평하게 취급되어야 합니다.
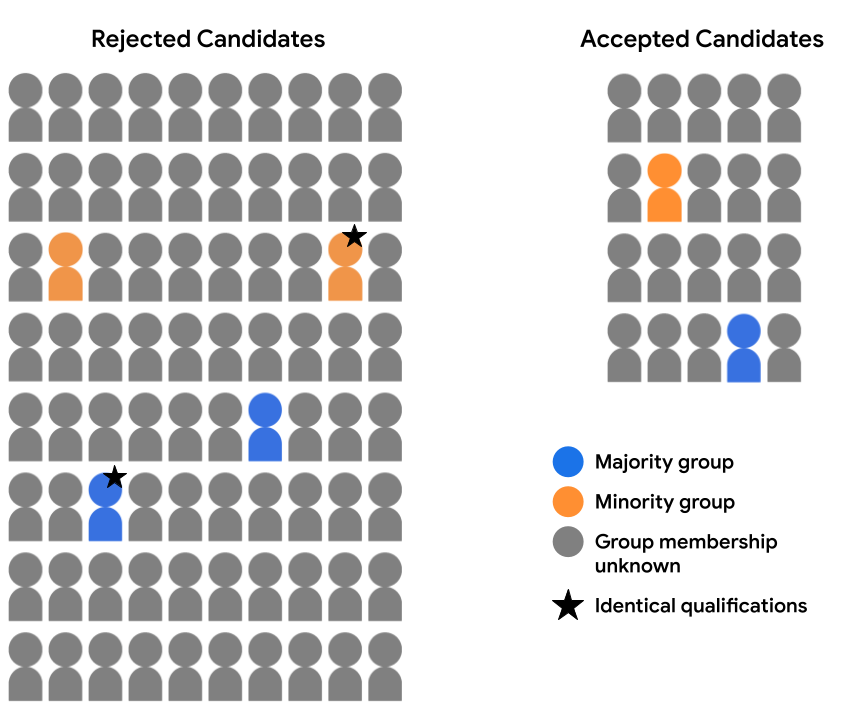
예를 들어 특성 데이터를 철저히 검토했다고 가정해 보겠습니다.
2명의 후보 (다수 집단 및 소수 집단 1개)에게 제공됨
별표 주석이 달린 그룹이 있음)를 실행하여
모든 면에서 동일하게 입학 자격이 주어집니다. 모델이
두 후보 모두에 대해 동일한 예측을 수행 (즉, 둘 다 거부함)
두 가지 모두를 수락하는 경우)는 반사실적인 경우
공정성을 평가합니다. 반사실적 공정성은
특정 민감한 속성을 제외하고 모든 면에서 동일한 예
(여기에서는 인구통계 그룹 멤버십)이 동일한 모델 을 얻습니다.
학습합니다.
그림 6. 동일한 두 추론에 대해 반사실적 공정성을 만족합니다.
주석이 포함된 예 (인구통계 그룹 구성원만 다름)
모델이 두 가지 모두에 대해 동일한 결정을 내리기 때문입니다 (거부됨).
장단점
앞서 언급했듯이 반사실적 공정성의 한 가지 주요 이점은
공정성 예측을 평가하는 데
다른 측정항목은 실현할 수 없습니다. 데이터 세트에 데이터 세트의 전체 집합이 포함되지 않은 경우
특성 값을 고려하는 경우 해당 그룹 속성에는
인구통계 동등성 또는 인구 평등을 사용하여 공정성을 평가할 수
있습니다. 그러나 이러한 그룹 속성을
유사한 문장을 찾아낸다는 점에서
실무자들은 반사실적 공정성 모델을 사용하여
모델을 사용하여 예측의 잠재적 편향을
탐색하기 위한 측정항목으로 사용할 수 있습니다
또한 인구통계 동등성과 동등성과 같은 측정항목이
기회는 그룹을 종합하여 평가하므로, 영향을 미치는 편향 문제를 은폐할 수 있습니다
개별 예측 수준에서 모델을 학습시킬 수 있으며, 이는
반사실적 공정성을 사용하여 평가합니다. 예를 들어 입학 허가가
다수 집단과 소수 집단에서 적합한 후보를 수용함
속한 집단이지만 가장 자격을 갖춘 소수 집단 후보는
가장 자격을 갖춘 과반수 후보자가
사용자 인증 정보가 허용됩니다 반사실적 공정성 분석은
이러한 종류의 불일치를 해결하여 해결할 수 있습니다.
반면에 반사실적 공정성의 주요 단점은
모델 예측의 편향을 전체적으로 파악할 수 있습니다. 식별 및
예시 쌍으로 소수의 불평등을 해결하는 것만으로는 충분하지 않을 수 있습니다.
전체 하위 그룹에 영향을 미치는 시스템적 편향 문제를 해결합니다.
가능한 경우 실무자는 두 가지를 모두 집계하여
공정성 분석 (인구통계 동등성 또는
반사실적 공정성 분석을 사용하여
광범위한 인사이트를 제공합니다
연습문제: 학습 내용 점검하기
<ph type="x-smartling-placeholder"></ph>
그림 7. 예시 배치에 대한 음성 예측 및 양성 예측
A, B, C라는 라벨이 지정된 세 쌍의 예시가 있습니다.
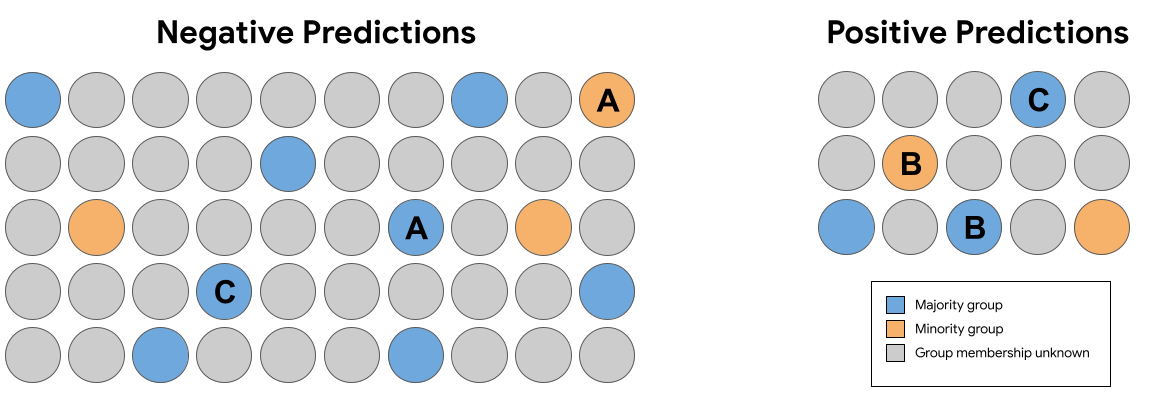
위 그림 7의 예측 세트에서
다음 동일한 쌍 (그룹 구성원 제외)
반사실적 공정성을 위반하는 예측을 받은 사례가 있습니까?
쌍 A
쌍 A의 예측은 다음과 같이 반사실적 공정성을 충족합니다.
다수 집단의 예 (파란색)와
소수 집단 (주황색)이 동일한 예측 (음성)을 받았습니다.
쌍 B
B 쌍의 예측은
다수 그룹의 예 (파란색)와
소수 집단 (주황색)이 동일한 예측 (양성)을 받았습니다.
C 페어링
쌍 C의 예측은 둘 다
다수결 그룹 (파란색) 모델이 다양한 종류의 데이터를 생성한다는 사실은
예측한 바에 따르면 2024년 10월 31일보다
성능 문제가 보다 포괄적이어야 하는데
조사했습니다. 하지만 이 결과는 반사실적인
공정성이라는 두 가지 조건이 충족되는 경우에만
동일한 예가 각각 다른 그룹에서 추출되었습니다.
이 쌍은 모두 반사실적 공정성을 위반하지 않습니다.
A와 B 쌍에 대한 예측은 반사실적 공정성을 충족합니다.
왜냐하면 두 경우 모두 다수 집단의 예와
동일한 예측을 수신합니다. C 페어링
두 예가 모두 동일한 그룹 (대다수 그룹)에 속하므로
반사실적 공정성은 이 경우에는 적용되지 않습니다.
요약
인구통계 동등성기회의 평등,
반사실적 공정성과 반사실적 공정성은 각각 다른 수학적 정의를
공정성을 유지해야 합니다 이 세 가지 옵션은
공정성을 정량화하는 방법을 배웠습니다. 공정성에 대한 일부 정의는 서로 상호 간에
호환되지 않음
즉, 일정 시간 동안 여러 번 동시에 충족시키는 것이 불가능할 수
예측하기 위한 것입니다.
그렇다면 '적절한' 옵션을 선택하는 방법은 공정성 측정항목을 사용해야 할까요? 해야 할 일
데이터가 사용되는 상황과 고려해야 할 중요한 목표를
있습니다. 예를 들어 모든 사람이 동일한
대표성을 달성한다는 목표를 달성하기 위해
(이 경우 인구통계 동등성이 최적의 측정항목일 수 있습니다) 아니면
기회의 균등(
측정항목)?
ML 공정성에 대해 자세히 알아보고 이러한 문제를 더 자세히 알아보려면 다음을 참조하세요.
솔론 바로카스, 모리츠 하트, 아르빈드 나라야난의 공정성과 머신러닝: 한계와 기회
[null,null,["최종 업데이트: 2024-08-13(UTC)"],[[["\u003cp\u003eCounterfactual fairness is a metric that evaluates fairness by comparing predictions for similar individuals, differing only in a sensitive attribute like demographic group.\u003c/p\u003e\n"],["\u003cp\u003eThis metric is particularly useful when datasets lack complete demographic information for all examples but contain it for a subset.\u003c/p\u003e\n"],["\u003cp\u003eWhile counterfactual fairness can identify individual-level biases, it might not address broader, systemic biases across subgroups.\u003c/p\u003e\n"],["\u003cp\u003eOther fairness metrics, such as demographic parity and equality of opportunity, provide a more holistic view but may require complete demographic data.\u003c/p\u003e\n"],["\u003cp\u003eSelecting the appropriate fairness metric depends on the specific application and desired outcome, with no single "right" metric universally applicable.\u003c/p\u003e\n"]]],[],null,["# Fairness: Counterfactual fairness\n\nThus far, our discussions of fairness metrics have assumed that our training\nand test examples contain comprehensive demographic data for the demographic\nsubgroups being evaluated. But often this isn't the case.\n\nSuppose our admissions dataset doesn't contain complete demographic data.\nInstead, demographic-group membership is recorded for just a small percentage\nof examples, such as students who opted to self-identify which group they\nbelonged to. In this case, the breakdown of our candidate pool into accepted\nand rejected students now looks like this:\n**Figure 5.** Candidate pool, with demographic-group membership unknown for nearly all candidates (icons shaded in gray).\n\nIt's not feasible here to evaluate model predictions for either demographic\nparity or equality of opportunity, because we don't have demographic data\nfor 94% of our examples. However, for the 6% of examples that do contain\ndemographic features, we can still compare pairs of individual predictions\n(a majority candidate vs. a minority candidate) and see if they have been\ntreated equitably by the model.\n\nFor example, let's say that we've thoroughly reviewed the feature data\navailable for two candidates (one in the majority group and one in the minority\ngroup, annotated with a star in the image below), and have determined that they\nare identically qualified for admission in all respects. If the model makes\nthe same prediction for both of these candidates (i.e., either rejects both\ncandidates or accepts both candidates), it is said to satisfy **counterfactual\nfairness** for these examples. Counterfactual fairness stipulates that two\nexamples that are identical in all respects, except a given sensitive attribute\n(here, demographic group membership), should result in the same model\nprediction.\n**Figure 6.** Counterfactual fairness is satisfied for the two identical examples (only varying in demographic group membership) annotated with a star, as the model makes the same decision for both (Rejected).\n\nBenefits and drawbacks\n----------------------\n\nAs mentioned earlier, one key benefit of counterfactual fairness is that it\ncan be used to evaluate predictions for fairness in many cases where using\nother metrics wouldn't be feasible. If a dataset doesn't contain a full set of\nfeature values for the relevant group attributes under consideration, it won't\nbe possible to evaluate fairness using demographic parity or equality of\nopportunity. However, if these group attributes are available for a subset\nof examples, and it's possible to identify comparable pairs of equivalent\nexamples in different groups, practitioners can use counterfactual fairness\nas a metric to probe the model for potential biases in predictions.\n\nAdditionally, because metrics like demographic parity and equality of\nopportunity assess groups in aggregate, they may mask bias issues that affect\nthe model at the level of individual predictions, which can be surfaced by\nevaluation using counterfactual fairness. For example, suppose our admissions\nmodel accepts qualified candidates from the majority group and the minority\ngroup in the same proportion, but the most qualified minority candidate is\nrejected whereas the most qualified majority candidate who has the exact same\ncredentials is accepted. A counterfactual fairness analysis can help identify\nthese sorts of discrepancies so that they can be addressed.\n\nOn the flipside, the key downside of counterfactual fairness is that it doesn't\nprovide as holistic a view of bias in model predictions. Identifying and\nremediating a handful of inequities in pairs of examples may not be sufficient\nto address systemic bias issues that affect entire subgroups of examples.\n\nIn cases where it's possible, practitioners can consider doing both an aggregate\nfairness analysis (using a metric like demographic parity or equality of\nopportunity) as well as a counterfactual fairness analysis to gain the widest\nrange of insights into potential bias issues in need of remediation.\n\nExercise: Check your understanding\n----------------------------------\n\n**Figure 7.** Negative and Positive predictions for a batch of examples, with three pairs of examples labeled as A, B, and C. \nIn the set of predictions in Figure 7 above, which of the\nfollowing pairs of identical (excluding group membership)\nexamples received predictions that violate counterfactual fairness? \nPair A \nPair A's predictions satisfy counterfactual fairness, as both the example in the majority group (blue) and the example in the minority group (orange) received the same prediction (Negative). \nPair B \nPair B's predictions satisfy counterfactual fairness, as both the example in the majority group (blue) and the example in the minority group (orange) received the same prediction (Positive). \nPair C \nPair C's predictions are for two examples that both belong to the majority group (blue). The fact that the model produced different predictions for these identical examples suggests that there may be broader performance issues with the model that should be investigated. However, this result does not violate counterfactual fairness, whose conditions only apply in cases where the two identical examples are each drawn from different groups. \nNone of these pairs violate counterfactual fairness \nThe predictions for Pairs A and B satisfy counterfactual fairness because in both cases, the example in the majority group and the example in the minority group receive the same prediction. Pair C's examples both belong to the same group (the majority group), so counterfactual fairness is not applicable in this case.\n\nSummary\n-------\n\n[Demographic parity](/machine-learning/crash-course/fairness/demographic-parity),\n[equality of opportunity](/machine-learning/crash-course/fairness/equality-of-opportunity),\nand counterfactual fairness each provide different mathematical definitions of\nfairness for model predictions. And those are just three possible\nways to quantify fairness. Some definitions of fairness are even [**mutually\nincompatible**](/machine-learning/glossary#incompatibility-of-fairness-metrics),\nmeaning it may be impossible to satisfy them simultaneously for a\ngiven model's predictions.\n\nSo how do you choose the \"right\" fairness metric for your model? You need to\nconsider the context in which it's being used and the overarching goals you\nwant to accomplish. For example, is the goal to achieve equal representation\n(in this case, demographic parity may be the optimal metric) or is it to\nachieve equal opportunity (here, equality of opportunity may be the best\nmetric)?\n\nTo learn more about ML Fairness and explore these issues in more depth, see\n[*Fairness and Machine Learning: Limitations and Opportunities*](https://fairmlbook.org/) by Solon Barocas, Moritz Hardt, and Arvind Narayanan.\n| **Key terms:**\n|\n| - [Bias (ethics/fairness)](/machine-learning/glossary#bias-ethicsfairness)\n| - [Demographic parity](/machine-learning/glossary#demographic-parity)\n- [Mutually incompatible](/machine-learning/glossary#incompatibility-of-fairness-metrics) \n[Help Center](https://support.google.com/machinelearningeducation)"]]