또는 조건을 충족하는 조건의 수락률을
과반수 집단과 소수 집단의
후보자입니다. 수락률이
두 그룹의 적격한 학생이 동일하다면 모델이
기회의 균등:
선호하는 라벨('입학 자격')이 있는 학생의 경우
속한 인구통계 그룹과 관계없이 입학 확률
있습니다.
이전 섹션의 후보 풀을 다시 살펴보겠습니다.
다수 집단
소수 집단
자격 있음
35
15
Unqualified(자격 없음)
45
5
입학 모델이 대다수 그룹에서 14명의 후보자를 승인한다고 가정하겠습니다.
소수 집단에서 6명의 후보가 선정되었습니다. 모델의 결정은
기회의 균등, 즉 적격 대다수의 수용율이
적합한 소수 집단 후보는 40%입니다
그림 4. 거부 및 수락된 후보 분류(모두 포함)
음영 처리된 대다수와 소수 집단의 유능한 학생
표시됩니다. 자격을 갖춘 과반수 집단 학생 35명 중 14명은
동의합니다. 자격을 갖춘 소수 집단 학생 15명 중 6명은
동의합니다. 따라서 두 그룹 모두 수락률은 40% 입니다.
학생으로 꼽을 수 있습니다
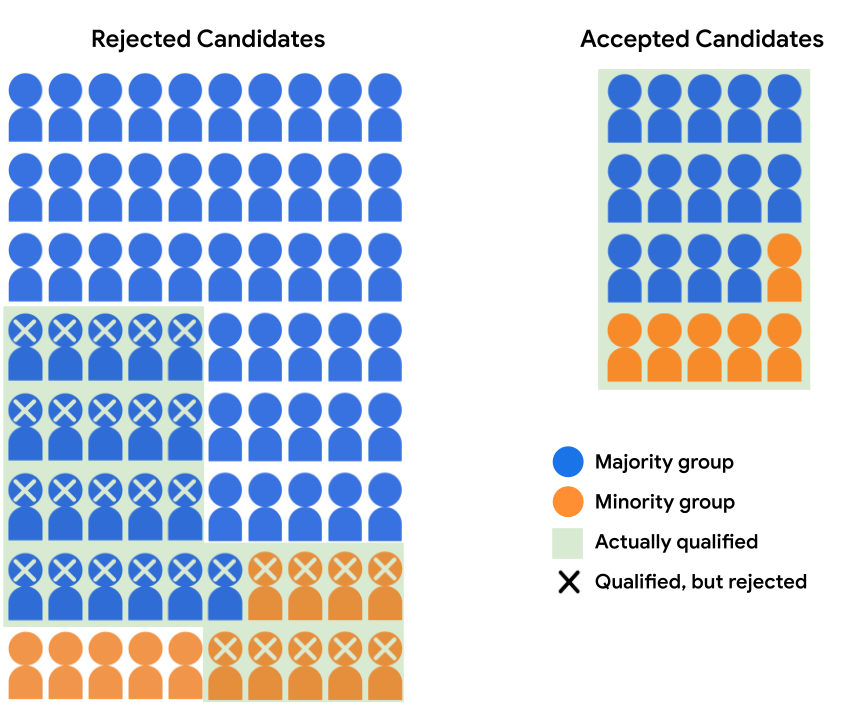
다음 표에는 거부 및 수락된 테스트를 뒷받침하는 수치를 수치로 제시하고 있습니다.
가능성이 있습니다.
다수 집단
소수 집단
수락됨
거부됨
수락됨
거부됨
자격 있음
14
21
6
9
Unqualified(자격 없음)
0
45
0
5
장단점
기회의 균등의 주요 이점은 모델의 예측이
인구통계 그룹에 따라 양성 예측 대비 음성 예측의 비율
모델이 선호 라벨을 예측하는 데 똑같이 성공할 경우
('입학 자격')을 받게 됩니다.
그림 4의 모델 예측은 인구통계 동등성을 충족하지 않습니다.
과반수 그룹의 학생으로 채택될 가능성은 17.5% 이며
소수 집단의 학생 중 입학 가능성이 30% 인 경우 하지만
자격 요건을 충족하는 학생의 경우 합격 확률은 40% 입니다.
이론상 타당한 결과를 보여주는 것으로
특정 모델 사용 사례를
살펴보겠습니다
기회의 균등의 한 가지 단점은 모든 AI가
명확한 선호 라벨이 있는 경우입니다. 마찬가지로
모델이 포지티브 클래스('입학 자격')를 모두 예측한다는 것을
네거티브 클래스('입학 자격 미충족')로 분류하면
대신 측정항목을 사용하여
균등화된 승산은
성공률이 같아야 합니다.
기회의 균등의 또 다른 단점은 공정성을 평가한다는 것입니다.
인구통계 그룹에 대해 집계된 오류율을 비교하여
항상 실행 가능하지는 않습니다 예를 들어 입장권 모델의 데이터 세트가
demographic_group 기능이 없으면 다음 작업을 할 수 없습니다.
적격 대다수 및 소수 후보의 수락률 분석
이를 비교하여 기회의 균등이 충족되는지 확인합니다.
다음 섹션에서는 또 다른 공정성 측정항목인 반사실적인
시나리오에 적용할 수 있는 공정성입니다.
항상 존재합니다
연습문제: 학습 내용 점검하기
참 또는 거짓: 이진 분류 모델은 불가능함
동일한 환경에서의 인구통계 동등성과 기회의 균등을 모두
사용할 수 있습니다
참
모델의 예측이 두 인구통계를 모두 만족시킬 수 있습니다.
기회의 평등과 기회의 균등입니다. 데이터 애널리스트가 사용할 수 있는
두 측정항목이 모두 충족되는 경우를 보고 나머지 측정항목을
아래의 답변을 선택하여 설명을 확인하세요.
거짓
모델의 예측이 두 인구통계를 모두 만족시킬 수 있습니다.
기회의 평등과 기회의 균등입니다.
예를 들어 '주목할 만한 분류 기준'이라는
포지티브 클래스임)을 평가한 결과
는 다음과 같은 혼동 행렬에서 볼 수 있으며,
인구통계 그룹 (대다수 및 소수):
[null,null,["최종 업데이트: 2024-08-13(UTC)"],[[["\u003cp\u003eEquality of opportunity in machine learning focuses on ensuring that qualified individuals have an equal chance of being accepted, regardless of their demographic group.\u003c/p\u003e\n"],["\u003cp\u003eIt's achieved when the acceptance rates for qualified individuals are the same across different demographic groups, as illustrated by the example with a 40% acceptance rate for qualified candidates in both the majority and minority groups.\u003c/p\u003e\n"],["\u003cp\u003eWhile it promotes fairness in specific scenarios, equality of opportunity has limitations, such as its dependence on a clear preferred label and potential challenges in situations lacking demographic data.\u003c/p\u003e\n"],["\u003cp\u003eUnlike demographic parity which focuses on overall acceptance rates, equality of opportunity concentrates on the acceptance rates within the qualified subset of each group.\u003c/p\u003e\n"],["\u003cp\u003eIt's possible for a model to satisfy both demographic parity and equality of opportunity simultaneously, under specific conditions where positive prediction rates and true positive rates are balanced across groups.\u003c/p\u003e\n"]]],[],null,["# Fairness: Equality of opportunity\n\nIn the previous section, we evaluated our admissions model for fairness using\ndemographic parity, by comparing the overall acceptance rates for both\ndemographic groups.\n\nAlternatively, we could compare the acceptance rates for just the qualified\ncandidates in the majority group and the minority group. If the acceptance rates\nfor qualified students in both groups are equal, the model exhibits\n[**equality of opportunity**](/machine-learning/glossary#equality_of_opportunity):\nstudents with our preferred label (\"qualified for admission\") have an equal\nchance of being admitted, irrespective of which demographic group they belong\nto.\n\nLet's revisit our candidate pool from the previous section:\n\n| | Majority group | Minority group |\n|-----------------|----------------|----------------|\n| **Qualified** | 35 | 15 |\n| **Unqualified** | 45 | 5 |\n\nSuppose the admissions model accepts 14 candidates from the majority group\nand 6 candidates from the minority group. The model's decisions satisfy\nequality of opportunity, as the acceptance rate for both qualified majority\nand qualified minority candidates is 40%.\n**Figure 4.** Breakdown of Rejected and Accepted candidates, with all qualified students in both the majority and minority groups shaded in green. Of the 35 qualified majority-group students, 14 were accepted. Of the 15 qualified minority-group students, 6 were accepted. Both groups thus have an acceptance rate of 40% for qualified students.\n\nThe following table quantifies the numbers supporting the rejected and accepted\ncandidates in Figure 4.\n\n| | Majority group || Minority group ||\n| | Accepted | Rejected | Accepted | Rejected |\n|-----------------|----------|----------|----------|----------|\n| **Qualified** | 14 | 21 | 6 | 9 |\n| **Unqualified** | 0 | 45 | 0 | 5 |\n\nBenefits and Drawbacks\n----------------------\n\nThe key benefit of equality of opportunity is that it allows the model's\nratio of positive to negative predictions to vary across demographic groups,\nprovided that the model is equally successful at predicting the preferred label\n(\"qualified for admission\") for both groups.\n\nThe model predictions in Figure 4 *do not* satisfy demographic parity,\nas a student in the majority group has a 17.5% chance of being accepted, and\na student in the minority group has a 30% chance of being accepted. However,\na qualified student has a 40% chance of being accepted, irrespective of which\ngroup they belong to, which is arguably an outcome that is more fair in this\nparticular model use case.\n\nOne drawback of equality of opportunity is that it is designed for use\ncases where there is a clear-cut preferred label. If it's equally important\nthat the model predict both the positive class (\"qualified for admission\")\nand negative class (\"not qualified for admission\") for all demographic groups,\nit may make sense to instead use the metric\n[**equalized odds**](/machine-learning/glossary#equalized-odds), which enforces\nequal success rates for both labels.\n\nAnother drawback of equality of opportunity is that it assesses fairness\nby comparing error rates in aggregate for demographic groups, which may\nnot always be feasible. For example, if our admissions model's dataset\ndid not have a feature of `demographic_group`, it would not be possible to\nbreak out acceptance rates for qualified majority and minority candidates\nand compare them to see if equality of opportunity is satisfied.\n\nIn the next section, we'll look at another fairness metric, counterfactual\nfairness, that can be employed in scenarios where demographic data doesn't\nexist for all examples.\n\nExercise: Check your understanding\n----------------------------------\n\nTrue or False: It is impossible for a binary classification model to satisfy both demographic parity and equality of opportunity on the same set of predictions. \nTrue \nIt's possible for a model's predictions to satisfy both demographic parity and equality of opportunity. See if you can think of a scenario where both metrics are satisfied, and then choose the other answer choice below to see our explanation. \nFalse \nIt's possible for a model's predictions to satisfy both demographic\nparity and equality of opportunity.\n\nFor example, let's say a binary classifier (whose preferred label\nis the positive class) is evaluated on 100 examples, with results\nshown in the following confusion matrices, broken out by\ndemographic group (majority and minority):\n\n| | Majority group || Minority group ||\n| | Predicted positive | Predicted negative | Predicted positive | Predicted negative |\n|---------------------|--------------------|--------------------|--------------------|--------------------|\n| **Actual positive** | 6 | 12 | 3 | 6 |\n| **Actual negative** | 10 | 36 | 6 | 21 |\n| | \\\\(\\\\text{Positive Rate} = \\\\frac{6+10}{6+10+12+36} = \\\\frac{16}{64} = \\\\text{25%}\\\\) \\\\(\\\\text{True Positive Rate} = \\\\frac{6}{6+12} = \\\\frac{6}{18} = \\\\text{33%}\\\\) || \\\\(\\\\text{Positive Rate} = \\\\frac{3+6}{3+6+6+21} = \\\\frac{9}{36} = \\\\text{25%}\\\\) \\\\(\\\\text{True Positive Rate} = \\\\frac{3}{3+6} = \\\\frac{3}{9} = \\\\text{33%}\\\\) ||\n\nBoth majority and minority groups have a positive prediction rate\nof 25%, satisfying demographic parity, and a true positive rate\n(percentage of examples with the preferred label that are\ncorrectly classified) of 33%, satisfying equality of opportunity.\n| **Key terms:**\n|\n| - [Bias (ethics/fairness)](/machine-learning/glossary#bias-ethicsfairness)\n| - [Equality of opportunity](/machine-learning/glossary#equality_of_opportunity)\n- [Equalized odds](/machine-learning/glossary#equalized-odds) \n[Help Center](https://support.google.com/machinelearningeducation)"]]