تنظيم صفحاتك في مجموعات
يمكنك حفظ المحتوى وتصنيفه حسب إعداداتك المفضّلة.
في بعض الأحيان، عندما يكون لدى ممارس الذكاء الاصطناعي معرفة بالموضوع تشير إلى أنّ متغيّرًا واحدًا مرتبط بمربع متغيّر آخر أو مكعبه أو أيّ درجة أخرى من السمات الحالية، يكون من المفيد إنشاء سمة اصطناعية من أحد السمات الرقمية الحالية.
فكِّر في الانتشار التالي لنقاط البيانات، حيث تمثّل الدوائر الوردية
فئة أو تصنيفًا واحدًا (مثلاً، نوع من الأشجار) والمثلثات الخضراء
فئة أخرى (أو نوعًا آخر من الأشجار):
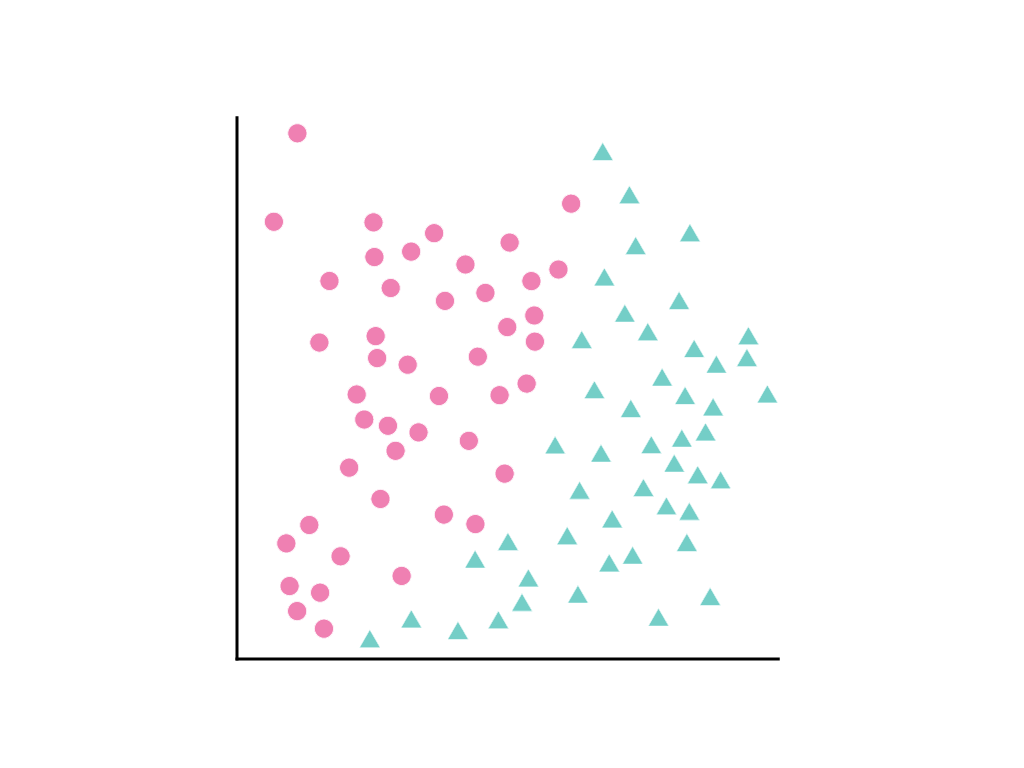
الشكل 17. فئتان لا يمكن فصلهما بخط
لا يمكن رسم خط مستقيم يفصل بين الفئتَين
بوضوح، ولكن يمكن رسم منحنى يفصل بينهما:
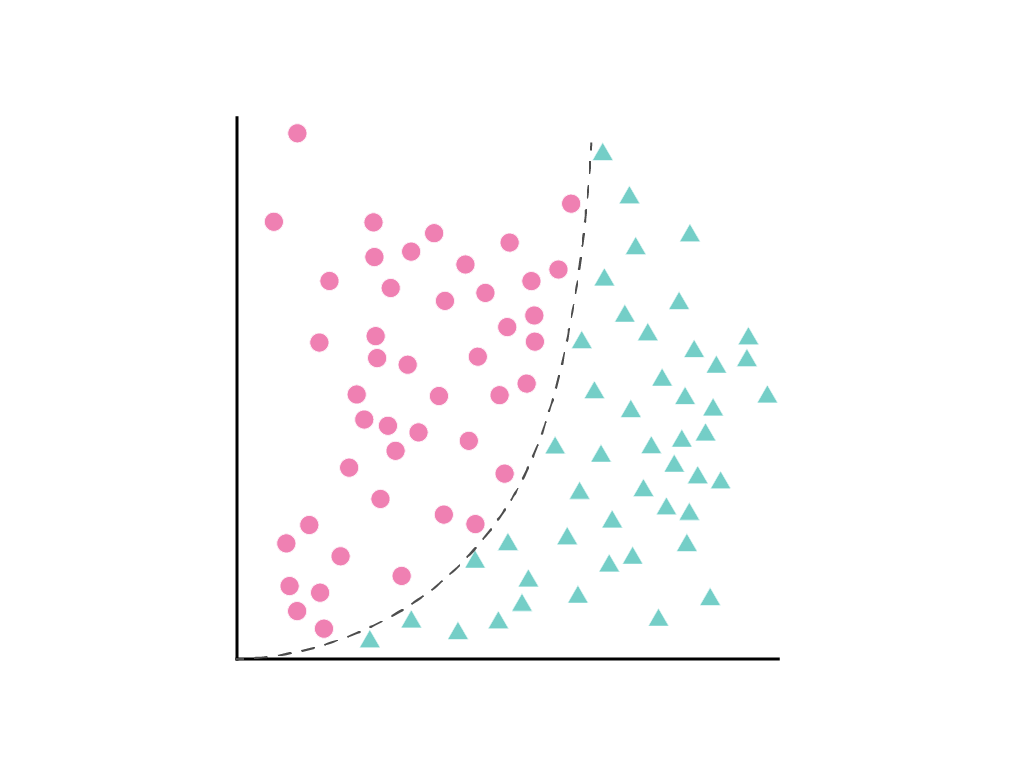
الشكل 18. فصل الفئات باستخدام y = x2
كما هو موضّح في
وحدة الانحدار الخطي،
يتم وصف نموذج خطي يتضمّن سمة واحدة، وهي $x_1$، بالمعادلة الخطية التالية:
$$y = b + w_1x_1$$
يتم التعامل مع الميزات الإضافية من خلال إضافة المصطلحات \(w_2x_2\)
\(w_3x_3\)وما إلى ذلك.
تبحث الطريقة التنازلية للانحدار عن
المرجح $w_1$ (أو المرجحين
\(w_1\)و \(w_2\)و \(w_3\)في حال توفّر ميزات إضافية) الذي يقلل
إلى أدنى حدّ من خسارة النموذج. ولكن لا يمكن فصل نقاط البيانات المعروضة بخط.
ما الذي يمكنني فعله؟
من الممكن الاحتفاظ بالمعادلة الخطية والسماح بعدم الخطية
من خلال تحديد مصطلح جديد، \(x_2\)، وهو ببساطة \(x_1\) مربّع:
$$x_2 = x_1^2$$
تُعامل هذه الميزة الاصطناعية، التي تُعرف باسم التحويل المتعدد الحدود، مثل أي
ميزة أخرى. تصبح الصيغة الخطية السابقة على النحو التالي:
$$y = b + w_1x_1 + w_2x_2$$
لا يزال بالإمكان التعامل مع ذلك على أنّه مشكلة
الانحدار الخطي
، ويتم تحديد الأوزان من خلال التدرج التنازلي كالمعتاد، على الرغم من
احتوائها على مصطلح مربّع مخفي، وهو التحويل المتعدّد الحدود. بدون تغيير
طريقة تدريب النموذج الخطي، تسمح إضافة تحويل متعدد الحدود لل
النموذج بفصل نقاط البيانات باستخدام منحنى من
الشكل $y = b + w_1x + w_2x^2$.
عادةً ما يتم ضرب السمة الرقمية المعنيّة بنفسها، أي يتم
رفعها إلى بعض الأسس. في بعض الأحيان، يمكن لأحد خبراء الذكاء الاصطناعي إجراء تخمين مدروس
حول الأس المناسب. على سبيل المثال، ترتبط العديد من العلاقات في الصعيد
الفيزيائي بعوامل مربّعة،
بما في ذلك التسارع الناتج عن الجاذبية،
وتلاشي الضوء أو الصوت على مسافة معيّنة، والطاقة الكامنة المرنة.
إذا كنت تحوّل سمة بطريقة تغيّر مقياسها، ننصحك بالتفكير في
تجربة تسويتها أيضًا. قد يؤدي تسويف البيانات بعد تحويلها
إلى تحسين أداء النموذج. لمزيد من المعلومات، يُرجى الاطّلاع على
البيانات الرقمية: التسويّة.
تاريخ التعديل الأخير: 2025-03-06 (حسب التوقيت العالمي المتفَّق عليه)
[null,null,["تاريخ التعديل الأخير: 2025-03-06 (حسب التوقيت العالمي المتفَّق عليه)"],[[["\u003cp\u003eSynthetic features, like polynomial transforms, enable linear models to represent non-linear relationships by introducing new features based on existing ones.\u003c/p\u003e\n"],["\u003cp\u003ePolynomial transforms involve raising an existing feature to a power, often informed by domain knowledge, such as physical laws involving squared terms.\u003c/p\u003e\n"],["\u003cp\u003eBy incorporating synthetic features, linear regression models can effectively separate data points that are not linearly separable using curves instead of straight lines.\u003c/p\u003e\n"],["\u003cp\u003eThis approach maintains the simplicity of linear regression while expanding its capacity to capture complex patterns within the data.\u003c/p\u003e\n"],["\u003cp\u003eFeature crosses, a related concept for categorical data, synthesize new features by combining existing features, further enhancing model flexibility.\u003c/p\u003e\n"]]],[],null,["# Numerical data: Polynomial transforms\n\nSometimes, when the ML practitioner has domain knowledge suggesting\nthat one variable is related to the square, cube, or other power of another\nvariable, it's useful to create a\n[**synthetic feature**](/machine-learning/glossary#synthetic_feature) from one\nof the existing numerical [**features**](/machine-learning/glossary#feature).\n\nConsider the following spread of data points, where pink circles represent\none class or category (for example, a species of tree) and green triangles\nanother class (or species of tree):\n**Figure 17.** Two classes that can't be separated by a line.\n\nIt's not possible to draw a straight line that cleanly separates the two\nclasses, but it *is* possible to draw a curve that does so:\n**Figure 18.** Separating the classes with *y = x^2^*.\n\nAs discussed in the\n[Linear regression module](/machine-learning/crash-course/linear-regression),\na linear model with one feature, $x_1$, is described by the linear equation: \n$$y = b + w_1x_1$$\n\nAdditional features are handled by the addition of terms \\\\(w_2x_2\\\\),\n\\\\(w_3x_3\\\\), etc.\n\n[**Gradient descent**](/machine-learning/glossary#gradient_descent) finds the\n[**weight**](/machine-learning/glossary#weight) $w_1$ (or weights\n\\\\(w_1\\\\), \\\\(w_2\\\\), \\\\(w_3\\\\), in the case of additional features) that minimizes\nthe loss of the model. But the data points shown cannot be separated by a line.\nWhat can be done?\n\nIt's possible to keep both the linear equation *and* allow nonlinearity\nby defining a new term, \\\\(x_2\\\\), that is simply \\\\(x_1\\\\) squared: \n$$x_2 = x_1\\^2$$\n\nThis synthetic feature, called a polynomial transform, is treated like any\nother feature. The previous linear formula becomes: \n$$y = b + w_1x_1 + w_2x_2$$\n\nThis can still be treated like a\n[**linear regression**](/machine-learning/glossary#linear_regression)\nproblem, and the weights determined through gradient descent, as usual, despite\ncontaining a hidden squared term, the polynomial transform. Without changing\nhow the linear model trains, the addition of a polynomial transform allows the\nmodel to separate the data points using a curve of the\nform $y = b + w_1x + w_2x\\^2$.\n\nUsually the numerical feature of interest is multiplied by itself, that is,\nraised to some power. Sometimes an ML practitioner can make an informed guess\nabout the appropriate exponent. For example, many relationships in the physical\nworld are related to squared terms,\nincluding acceleration due to gravity, the\nattenuation of light or sound over distance, and elastic potential energy.\n\nIf you transform a feature in a way that changes its scale, you should consider\nexperimenting with normalizing it as well. Normalizing after transforming\nmight make the model perform better. For more information, see\n[Numerical Data: Normalization](/machine-learning/crash-course/numerical-data/normalization).\n\nA related concept in\n[**categorical data**](/machine-learning/glossary#categorical_data) is the\n[**feature cross**](/machine-learning/glossary#feature_cross), which more\nfrequently synthesizes two different features.\n| **Key terms:**\n|\n| - [Categorical data](/machine-learning/glossary#categorical_data)\n| - [Feature](/machine-learning/glossary#feature)\n| - [Feature cross](/machine-learning/glossary#feature_cross)\n| - [Gradient descent](/machine-learning/glossary#gradient_descent)\n| - [Linear regression](/machine-learning/glossary#linear_regression)\n| - [Synthetic feature](/machine-learning/glossary#synthetic_feature)\n- [Weight](/machine-learning/glossary#weight) \n[Help Center](https://support.google.com/machinelearningeducation)"]]