
擬真成像 3D 圖塊採用 OGC 標準 glTF 格式,因此您可以使用任何支援 OGC 3D 圖塊規格的顯示器,建構 3D 視覺化內容。舉例來說,Cesium 是用於算繪 3D 視覺化內容的基礎開放原始碼程式庫。
使用 CesiumJS
CesiumJS 是開放原始碼的 JavaScript 程式庫,可在網路上進行 3D 視覺化。如要進一步瞭解如何使用 CesiumJS,請參閱「學習 CesiumJS」。
使用者控制項
CesiumJS 圖塊算繪器有一組標準的使用者控制項。
| 動作 | 說明 |
|---|---|
| 平移檢視畫面 | 按一下滑鼠左鍵並拖曳 |
| 縮放檢視畫面 | 按一下滑鼠右鍵並拖曳,或捲動滑鼠滾輪 |
| 旋轉檢視畫面 | 按住 Ctrl 鍵並按一下滑鼠左鍵/右鍵並拖曳,或按住滑鼠中鍵並拖曳 |
最佳做法
您可以採取幾種做法,縮短 CesiumJS 3D 載入時間。例如:
在算繪 HTML 中加入下列陳述式,啟用同步要求:
Cesium.RequestScheduler.requestsByServer["tile.googleapis.com:443"] = <REQUEST_COUNT>REQUEST_COUNT值越高,圖塊載入速度就越快。不過,在 Chrome 瀏覽器中載入REQUEST_COUNT大於 10 且停用快取時,可能會遇到已知的 Chrome 問題。 在大多數情況下,建議使用REQUEST_COUNT18,以達到最佳效能。啟用略過詳細程度層級。詳情請參閱這項 Cesium 問題。
請啟用showCreditsOnScreen: true,確保正確顯示資料出處。詳情請參閱「政策」。
算繪指標
如要找出影格速率,請查看每秒呼叫 requestAnimationFrame 方法的次數。
如要瞭解影格延遲時間的計算方式,請參閱 PerformanceDisplay 類別。
CesiumJS 轉譯器範例
只要提供根圖塊集網址,即可搭配 Map Tiles API 的 3D 圖塊使用 CesiumJS 算繪器。
簡單範例
以下範例會初始化 CesiumJS 算繪器,然後載入根圖塊集。
<!DOCTYPE html>
<head>
  <meta charset="utf-8">
  <title>CesiumJS 3D Tiles Simple Demo</title>
  <script src="https://ajax.googleapis.com/ajax/libs/cesiumjs/1.105/Build/Cesium/Cesium.js"></script>
  <link href="https://ajax.googleapis.com/ajax/libs/cesiumjs/1.105/Build/Cesium/Widgets/widgets.css" rel="stylesheet">
</head>
<body>
  <div id="cesiumContainer"></div>
  <script>

    // Enable simultaneous requests.
    Cesium.RequestScheduler.requestsByServer["tile.googleapis.com:443"] = 18;

    // Create the viewer.
    const viewer = new Cesium.Viewer('cesiumContainer', {
      imageryProvider: false,
      baseLayerPicker: false,
      geocoder: false,
      globe: false,
      // https://cesium.com/blog/2018/01/24/cesium-scene-rendering-performance/#enabling-request-render-mode
      requestRenderMode: true,
    });

    // Add 3D Tiles tileset.
    const tileset = viewer.scene.primitives.add(new Cesium.Cesium3DTileset({
      url: "https://tile.googleapis.com/v1/3dtiles/root.json?key=YOUR_API_KEY",
      // This property is needed to appropriately display attributions
      // as required.
      showCreditsOnScreen: true,
    }));
  </script>
</body>
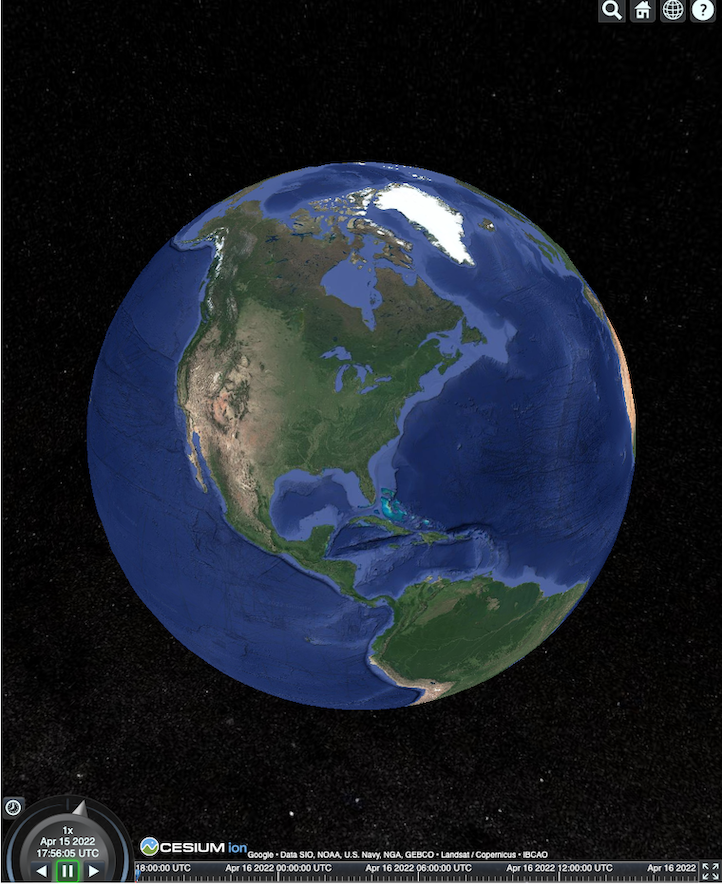
如要瞭解 requestRenderMode,請參閱「啟用請求顯示模式」。
HTML 網頁的轉譯結果如下所示。
整合 Places API
您可以搭配使用 CesiumJS 與 Places API 來擷取更多資訊。您可以使用 Autocomplete 小工具,飛往地點的可視區域。本範例使用 Places Autocomplete API,請按照這些操作說明啟用該 API,並使用 Maps JavaScript API,請按照這些操作說明啟用該 API。
<!DOCTYPE html>
<head>
 <meta charset="utf-8" />
 <title>CesiumJS 3D Tiles Places API Integration Demo</title>
 <script src="https://ajax.googleapis.com/ajax/libs/cesiumjs/1.105/Build/Cesium/Cesium.js"></script>
 <link href="https://ajax.googleapis.com/ajax/libs/cesiumjs/1.105/Build/Cesium/Widgets/widgets.css" rel="stylesheet">
</head>
<body>
 <label for="pacViewPlace">Go to a place: </label>
 <input
   type="text"
   id="pacViewPlace"
   name="pacViewPlace"
   placeholder="Enter a location..."
   style="width: 300px"
 />
 <div id="cesiumContainer"></div>
 <script>
   // Enable simultaneous requests.
   Cesium.RequestScheduler.requestsByServer["tile.googleapis.com:443"] = 18;

   // Create the viewer.
   const viewer = new Cesium.Viewer("cesiumContainer", {
     imageryProvider: false,
     baseLayerPicker: false,
     requestRenderMode: true,
     geocoder: false,
     globe: false,
   });

   // Add 3D Tiles tileset.
   const tileset = viewer.scene.primitives.add(
     new Cesium.Cesium3DTileset({
       url: "https://tile.googleapis.com/v1/3dtiles/root.json?key=YOUR_API_KEY",
       // This property is required to display attributions as required.
       showCreditsOnScreen: true,
     })
   );

   const zoomToViewport = (viewport) => {
     viewer.entities.add({
       polyline: {
         positions: Cesium.Cartesian3.fromDegreesArray([
           viewport.getNorthEast().lng(), viewport.getNorthEast().lat(),
           viewport.getSouthWest().lng(), viewport.getNorthEast().lat(),
           viewport.getSouthWest().lng(), viewport.getSouthWest().lat(),
           viewport.getNorthEast().lng(), viewport.getSouthWest().lat(),
           viewport.getNorthEast().lng(), viewport.getNorthEast().lat(),
         ]),
         width: 10,
         clampToGround: true,
         material: Cesium.Color.RED,
       },
     });
     viewer.flyTo(viewer.entities);
   };

   function initAutocomplete() {
     const autocomplete = new google.maps.places.Autocomplete(
       document.getElementById("pacViewPlace"),
       {
         fields: [
           "geometry",
           "name",
         ],
       }
     );
     autocomplete.addListener("place_changed", () => {
       viewer.entities.removeAll();
       const place = autocomplete.getPlace();
       if (!place.geometry || !place.geometry.viewport) {
         window.alert("No viewport for input: " + place.name);
         return;
       }
       zoomToViewport(place.geometry.viewport);
     });
   }
 </script>
 <script
   async=""
   src="https://maps.googleapis.com/maps/api/js?key=YOUR_API_KEY&libraries=places&callback=initAutocomplete"
 ></script>
</body>
旋轉無人機視角
你可以控制攝影機,透過圖塊集製作動畫。結合 Places API 和 Elevation API 後,這項動畫就能模擬任何搜尋點的互動式無人機飛越畫面。
這個程式碼範例會帶您環繞 Autocomplete 小工具中選取的地點。
<!DOCTYPE html>
<head>
  <meta charset="utf-8" />
  <title>CesiumJS 3D Tiles Rotating Drone View Demo</title>
  <script src="https://ajax.googleapis.com/ajax/libs/cesiumjs/1.105/Build/Cesium/Cesium.js"></script>
  <link href="https://ajax.googleapis.com/ajax/libs/cesiumjs/1.105/Build/Cesium/Widgets/widgets.css" rel="stylesheet">
</head>
<body>
  <label for="pacViewPlace">Go to a place: </label>
  <input type="text" id="pacViewPlace" name="pacViewPlace" placeholder="Enter a location..." style="width: 300px" />
  <div id="cesiumContainer"></div>
  <script>
    // Enable simultaneous requests.
    Cesium.RequestScheduler.requestsByServer["tile.googleapis.com:443"] = 18;

    // Create the viewer and remove unneeded options.
    const viewer = new Cesium.Viewer("cesiumContainer", {
      imageryProvider: false,
      baseLayerPicker: false,
      homeButton: false,
      fullscreenButton: false,
      navigationHelpButton: false,
      vrButton: false,
      sceneModePicker: false,
      geocoder: false,
      globe: false,
      infobox: false,
      selectionIndicator: false,
      timeline: false,
      projectionPicker: false,
      clockViewModel: null,
      animation: false,
      requestRenderMode: true,
    });

    // Add 3D Tile set.
    const tileset = viewer.scene.primitives.add(
      new Cesium.Cesium3DTileset({
        url: "https://tile.googleapis.com/v1/3dtiles/root.json?key=YOUR_API_KEY",
        // This property is required to display attributions.
        showCreditsOnScreen: true,
      })
    );

    // Point the camera at a location and elevation, at a viewport-appropriate distance.
    function pointCameraAt(location, viewport, elevation) {
      const distance = Cesium.Cartesian3.distance(
        Cesium.Cartesian3.fromDegrees(
          viewport.getSouthWest().lng(), viewport.getSouthWest().lat(), elevation),
        Cesium.Cartesian3.fromDegrees(
          viewport.getNorthEast().lng(), viewport.getNorthEast().lat(), elevation)
      ) / 2;
      const target = new Cesium.Cartesian3.fromDegrees(location.lng(), location.lat(), elevation);
      const pitch = -Math.PI / 4;
      const heading = 0;
      viewer.camera.lookAt(target, new Cesium.HeadingPitchRange(heading, pitch, distance));
    }

    // Rotate the camera around a location and elevation, at a viewport-appropriate distance.
    let unsubscribe = null;
    function rotateCameraAround(location, viewport, elevation) {
      if(unsubscribe) unsubscribe();
      pointCameraAt(location, viewport, elevation);
      unsubscribe = viewer.clock.onTick.addEventListener(() => {
        viewer.camera.rotate(Cesium.Cartesian3.UNIT_Z);
      });
    }

    function initAutocomplete() {
      const autocomplete = new google.maps.places.Autocomplete(
        document.getElementById("pacViewPlace"), {
          fields: [
            "geometry",
            "name",
          ],
        }
      );

      autocomplete.addListener("place_changed", async () => {
        const place = autocomplete.getPlace();

        if (!(place.geometry && place.geometry.viewport && place.geometry.location)) {
          window.alert(`Insufficient geometry data for place: ${place.name}`);
          return;
        }
        // Get place elevation using the ElevationService.
        const elevatorService = new google.maps.ElevationService();
        const elevationResponse =  await elevatorService.getElevationForLocations({
          locations: [place.geometry.location],
        });

        if(!(elevationResponse.results && elevationResponse.results.length)){
          window.alert(`Insufficient elevation data for place: ${place.name}`);
          return;
        }
        const elevation = elevationResponse.results[0].elevation || 10;

        rotateCameraAround(
          place.geometry.location,
          place.geometry.viewport,
          elevation
        );
      });
    }
  </script>
  <script async src="https://maps.googleapis.com/maps/api/js?key=YOUR_API_KEY&libraries=places&callback=initAutocomplete"></script>
</body>
繪製折線和標籤
這個程式碼範例說明如何在 Google 地圖中加入折線和標籤。您可以在地圖中加入折線,顯示開車和步行路線、房地產界線,或計算開車和步行時間。您也可以取得屬性,不必實際算繪場景。
您可以帶使用者來一趟精心規劃的鄰里導覽,或是顯示目前待售的鄰近房產,然後在場景中加入廣告看板等 3D 物件。
您可以總結行程,列出您看過的房源,並在虛擬物件中顯示這些詳細資料。
<!DOCTYPE html>
<head>
  <meta charset="utf-8" />
  <title>CesiumJS 3D Tiles Polyline and Label Demo</title>
  <script src="https://ajax.googleapis.com/ajax/libs/cesiumjs/1.105/Build/Cesium/Cesium.js"></script>
  <link
    href="https://ajax.googleapis.com/ajax/libs/cesiumjs/1.105/Build/Cesium/Widgets/widgets.css"
    rel="stylesheet"
  />
</head>
<body>
  <div id="cesiumContainer"></div>
  <script>
    // Enable simultaneous requests.
    Cesium.RequestScheduler.requestsByServer["tile.googleapis.com:443"] = 18;

    // Create the viewer.
    const viewer = new Cesium.Viewer("cesiumContainer", {
      imageryProvider: false,
      baseLayerPicker: false,
      requestRenderMode: true,
      geocoder: false,
      globe: false,
    });

    // Add 3D Tiles tileset.
    const tileset = viewer.scene.primitives.add(
      new Cesium.Cesium3DTileset({
        url: "https://tile.googleapis.com/v1/3dtiles/root.json?key=YOUR_API_KEY",

        // This property is required to display attributions as required.
        showCreditsOnScreen: true,
      })
    );

    // Draws a circle at the position, and a line from the previous position.
    const drawPointAndLine = (position, prevPosition) => {
      viewer.entities.removeAll();
      if (prevPosition) {
        viewer.entities.add({
          polyline: {
            positions: [prevPosition, position],
            width: 3,
            material: Cesium.Color.WHITE,
            clampToGround: true,
            classificationType: Cesium.ClassificationType.CESIUM_3D_TILE,
          },
        });
      }
      viewer.entities.add({
        position: position,
        ellipsoid: {
          radii: new Cesium.Cartesian3(1, 1, 1),
          material: Cesium.Color.RED,
        },
      });
    };

    // Compute, draw, and display the position's height relative to the previous position.
    var prevPosition;
    const processHeights = (newPosition) => {
      drawPointAndLine(newPosition, prevPosition);

      const newHeight = Cesium.Cartographic.fromCartesian(newPosition).height;
      let labelText = "Current altitude (meters above sea level):\n\t" + newHeight;
      if (prevPosition) {
        const prevHeight =
          Cesium.Cartographic.fromCartesian(prevPosition).height;
        labelText += "\nHeight from previous point (meters):\n\t" + Math.abs(newHeight - prevHeight);
      }
      viewer.entities.add({
        position: newPosition,
        label: {
          text: labelText,
          disableDepthTestDistance: Number.POSITIVE_INFINITY,
          pixelOffset: new Cesium.Cartesian2(0, -10),
          showBackground: true,
          verticalOrigin: Cesium.VerticalOrigin.BOTTOM,
        }
      });

      prevPosition = newPosition;
    };

    const handler = new Cesium.ScreenSpaceEventHandler(viewer.canvas);
    handler.setInputAction(function (event) {
      const earthPosition = viewer.scene.pickPosition(event.position);
      if (Cesium.defined(earthPosition)) {
        processHeights(earthPosition);
      }
    }, Cesium.ScreenSpaceEventType.LEFT_CLICK);
  </script>
</body>
攝影機軌跡
在 Cesium 中,您可以讓攝影機繞著搜尋點旋轉,避免與建築物發生碰撞。或者,您也可以在攝影機穿過建築物時,將建築物設為透明。
首先,將攝影機鎖定在某個點上,然後建立攝影機軌跡,展示資產。您可以使用相機的 lookAtTransform 函式和事件監聽器來執行這項操作,如這個程式碼範例所示。
// Lock the camera onto a point.
const center = Cesium.Cartesian3.fromRadians(
  2.4213211833389243,
  0.6171926869414084,
  3626.0426275055174
);

const transform = Cesium.Transforms.eastNorthUpToFixedFrame(center);

viewer.scene.camera.lookAtTransform(
  transform,
  new Cesium.HeadingPitchRange(0, -Math.PI / 8, 2900)
);

// Orbit around this point.
viewer.clock.onTick.addEventListener(function (clock) {
  viewer.scene.camera.rotateRight(0.005);
});
如要進一步瞭解如何控制攝影機,請參閱控制攝影機
使用 Cesium for Unreal
如要搭配使用 Cesium for Unreal 外掛程式和 3D Tiles API,請按照下列步驟操作。
安裝 Cesium for Unreal 外掛程式。
建立新的 Unreal 專案。
連線至 Google 擬真成像 3D 圖塊 API。
依序選取選單中的「Cesium」 >「Cesium」,開啟 Cesium 視窗。
選取「空白 3D 圖塊圖塊集」。
在「World Outliner」中,選取這個「Cesium3DTileset」,開啟「Details」面板。
將「來源」從「來自 Cesium Ion」變更為「來自網址」。
將網址設為 Google 3D Tiles 網址。
https://tile.googleapis.com/v1/3dtiles/root.json?key=YOUR_API_KEY- 啟用「在畫面上顯示出處」,即可正確顯示出處資訊。
這會載入世界。如要移至任何 LatLng,請在「大綱工具」面板中選取「CesiumGeoreference」項目,然後在「詳細資料」面板中編輯「原始緯度/經度/高度」。
使用 Cesium for Unity
如要在 Cesium for Unity 中使用擬真地圖方塊,請按照下列步驟操作。
建立新的 Unity 專案。
在「Package Manager」部分新增範圍登錄 (透過「Editor」 >「Project Settings」)。
名稱:Cesium
網址:https://unity.pkg.cesium.com
範圍:com.cesium.unity
安裝 Cesium for Unity 套件。
連線至 Google 擬真成像 3D 圖塊 API。
依序選取選單中的「Cesium」 >「Cesium」,開啟 Cesium 視窗。
按一下「空白 3D 圖塊圖塊集」。
在左側面板的「來源」下方,選取「圖塊集來源」選項,然後選取「來自網址」 (而非「來自 Cesium Ion」)。
將網址設為 Google 3D Tiles 網址。
https://tile.googleapis.com/v1/3dtiles/root.json?key=YOUR_API_KEY- 啟用「在畫面上顯示出處」,即可正確顯示出處資訊。
這會載入世界。如要移至任何 LatLng,請在「Scene Hierarchy」(場景階層) 中選取「CesiumGeoreference」項目,然後在「Inspector」(檢查器) 中編輯「Origin Latitude/Longitude/Height」(原始緯度/經度/高度)。
使用 deck.gl
deck.gl 是採用 WebGL 技術的開放原始碼 JavaScript 架構,可呈現高效能的大規模資料視覺化效果。
歸因
請務必擷取圖塊 gltf 中的 copyright asset 欄位,並顯示在算繪的檢視畫面中,確保正確顯示資料出處。詳情請參閱「顯示資料出處」。
deck.gl 算繪器範例
簡單範例
以下範例會初始化 deck.gl 算繪器,然後載入 3D 地點。請務必將程式碼中的 YOUR_API_KEY 替換成實際的 API 金鑰。
<!DOCTYPE html>
<html>
 <head>
   <title>deck.gl Photorealistic 3D Tiles example</title>
   <script src="https://unpkg.com/deck.gl@latest/dist.min.js"></script>
   <style>
     body { margin: 0; padding: 0;}
     #map { position: absolute; top: 0;bottom: 0;width: 100%;}
     #credits { position: absolute; bottom: 0; right: 0; padding: 2px; font-size: 15px; color: white;
        text-shadow: -1px 0 black, 0 1px black, 1px 0 black, 0 -1px black;}
   </style>
 </head>

 <body>
   <div id="map"></div>
   <div id="credits"></div>
   <script>
     const GOOGLE_API_KEY = YOUR_API_KEY;
     const TILESET_URL = `https://tile.googleapis.com/v1/3dtiles/root.json`;
     const creditsElement = document.getElementById('credits');
     new deck.DeckGL({
       container: 'map',
       initialViewState: {
         latitude: 50.0890,
         longitude: 14.4196,
         zoom: 16,
         bearing: 90,
         pitch: 60,
         height: 200
       },
       controller: {minZoom: 8},
       layers: [
         new deck.Tile3DLayer({
           id: 'google-3d-tiles',
           data: TILESET_URL,
           loadOptions: {
            fetch: {
              headers: {
                'X-GOOG-API-KEY': GOOGLE_API_KEY
              }
            }
          },
           onTilesetLoad: tileset3d => {
             tileset3d.options.onTraversalComplete = selectedTiles => {
               const credits = new Set();
               selectedTiles.forEach(tile => {
                 const {copyright} = tile.content.gltf.asset;
                 copyright.split(';').forEach(credits.add, credits);
                 creditsElement.innerHTML = [...credits].join('; ');
               });
               return selectedTiles;
             }
           }
         })
       ]
     });
   </script>
 </body>
</html>
在 Google 擬真 3D 圖塊上顯示 2D 圖層
deck.gl TerrainExtension 會將 2D 資料算繪到 3D 表面上。舉例來說,您可以將建築物足跡的 GeoJSON 覆蓋在擬真 3D 圖塊幾何圖形上。
在下列範例中,建築物圖層會以多邊形呈現,並配合實感 3D 圖塊表面調整。
<!DOCTYPE html>
<html>
 <head>
   <title>Google 3D tiles example</title>
   <script src="https://unpkg.com/deck.gl@latest/dist.min.js"></script>
   <style>
     body { margin: 0; padding: 0;}
     #map { position: absolute; top: 0;bottom: 0;width: 100%;}
     #credits { position: absolute; bottom: 0; right: 0; padding: 2px; font-size: 15px; color: white;
        text-shadow: -1px 0 black, 0 1px black, 1px 0 black, 0 -1px black;}
   </style>
 </head>

 <body>
   <div id="map"></div>
   <div id="credits"></div>
   <script>
     const GOOGLE_API_KEY = YOUR_API_KEY;
     const TILESET_URL = `https://tile.googleapis.com/v1/3dtiles/root.json`;
     const BUILDINGS_URL = 'https://raw.githubusercontent.com/visgl/deck.gl-data/master/examples/google-3d-tiles/buildings.geojson'
     const creditsElement = document.getElementById('credits');
     const deckgl = new deck.DeckGL({
       container: 'map',
       initialViewState: {
         latitude: 50.0890,
         longitude: 14.4196,
         zoom: 16,
         bearing: 90,
         pitch: 60,
         height: 200
       },
       controller: true,
       layers: [
         new deck.Tile3DLayer({
           id: 'google-3d-tiles',
           data: TILESET_URL,
           loadOptions: {
            fetch: {
              headers: {
                'X-GOOG-API-KEY': GOOGLE_API_KEY
              }
            }
          },
          onTilesetLoad: tileset3d => {
             tileset3d.options.onTraversalComplete = selectedTiles => {
               const credits = new Set();
               selectedTiles.forEach(tile => {
                 const {copyright} = tile.content.gltf.asset;
                 copyright.split(';').forEach(credits.add, credits);
                 creditsElement.innerHTML = [...credits].join('; ');
               });
               return selectedTiles;
             }
           },
           operation: 'terrain+draw'
         }),
         new deck.GeoJsonLayer({
           id: 'buildings',
           // This dataset is created by CARTO, using other Open Datasets available. More info at: https://3dtiles.carto.com/#about.
           data: 'https://raw.githubusercontent.com/visgl/deck.gl-data/master/examples/google-3d-tiles/buildings.geojson',
           stroked: false,
           filled: true,
           getFillColor: ({properties}) => {
             const {tpp} = properties;
             // quantiles break
             if (tpp < 0.6249)
               return [254, 246, 181]
             else if (tpp < 0.6780)
               return [255, 194, 133]
             else if (tpp < 0.8594)
               return [250, 138, 118]
             return [225, 83, 131]
           },
           opacity: 0.2,
           extensions: [new deck._TerrainExtension()]
         })
       ]
     });
   </script>
 </body>
</html>