FeatureStyleFunction হল সেই জায়গা যেখানে আপনি একটি ডেটাসেটে বৈশিষ্ট্যগুলিকে বেছে বেছে স্টাইল করার জন্য লজিক সংজ্ঞায়িত করেন। এটি এই লজিকের উপর ভিত্তি করে FeatureStyleOptions প্রদান করে। যদি স্টাইলিং লজিকের প্রয়োজন না হয়, তাহলে আপনি সরাসরি স্টাইল সেট করতে FeatureStyleOptions ব্যবহার করতে পারেন। এই পৃষ্ঠাটি আপনাকে দেখায় কিভাবে একটি মানচিত্রে একটি ডেটাসেট যোগ করতে হয় এবং স্টাইলিং প্রয়োগ করতে হয়।
পূর্বশর্ত
এগিয়ে যাওয়ার আগে, আপনার একটি মানচিত্র আইডি এবং মানচিত্র শৈলী এবং একটি ডেটাসেট আইডি থাকা উচিত।
একটি ডেটাসেট আইডি একটি মানচিত্র শৈলীর সাথে সংযুক্ত করুন
আপনার ব্যবহার করা মানচিত্র শৈলীর সাথে আপনার ডেটাসেট সংযুক্ত করতে নিম্নলিখিত পদক্ষেপগুলি গ্রহণ করুন:
- গুগল ক্লাউড কনসোলে, ডেটাসেট পৃষ্ঠায় যান ।
- ডেটাসেটের নামে ক্লিক করুন। ডেটাসেটের বিবরণ পৃষ্ঠাটি প্রদর্শিত হবে।
- প্রিভিউ ট্যাবে ক্লিক করুন।
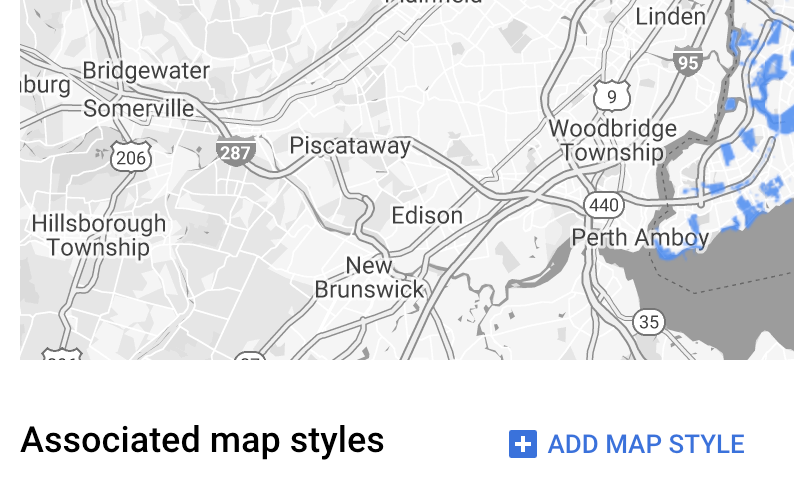
- ADD MAP STYLE- এ স্ক্রোল করুন এবং ক্লিক করুন।

- ম্যাপ স্টাইল(গুলি) সংযুক্ত করার জন্য চেকবক্স(গুলি) ক্লিক করুন এবং তারপর SAVE এ ক্লিক করুন।
সহজ স্টাইল নিয়ম ব্যবহার করুন
স্টাইল ফিচারের সবচেয়ে সহজ উপায় হল রঙ, অস্বচ্ছতা এবং লাইন ওয়েটের মতো স্টাইল অ্যাট্রিবিউট নির্ধারণের জন্য একটি FeatureStyleOptions পাস করা। সরাসরি একটি ডেটাসেট ফিচার লেয়ারে ফিচার স্টাইল অপশন প্রয়োগ করুন, অথবা FeatureStyleFunction এর সাথে একত্রে ব্যবহার করুন।
টাইপস্ক্রিপ্ট
const styleOptions = { strokeColor: 'green', strokeWeight: 2, strokeOpacity: 1, fillColor: 'green', fillOpacity: 0.3, };
জাভাস্ক্রিপ্ট
const styleOptions = { strokeColor: "green", strokeWeight: 2, strokeOpacity: 1, fillColor: "green", fillOpacity: 0.3, };
ঘোষণামূলক শৈলীর নিয়ম ব্যবহার করুন
FeatureStyleFunction ব্যবহার করে স্টাইলের নিয়মগুলি ঘোষণামূলকভাবে সেট করুন এবং আপনার সমগ্র ডেটাসেটে প্রয়োগ করুন। ডেটাসেট অ্যাট্রিবিউট মানের উপর ভিত্তি করে একটি বৈশিষ্ট্যে FeatureStyleOptions প্রয়োগ করুন। আপনি আপনার ফিচার স্টাইল ফাংশন থেকে null ও ফেরত দিতে পারেন, উদাহরণস্বরূপ যদি আপনি চান যে বৈশিষ্ট্যগুলির একটি উপসেট অদৃশ্য থাকে। এই উদাহরণে একটি স্টাইল ফাংশন দেখানো হয়েছে যা ডেটা অ্যাট্রিবিউটের উপর ভিত্তি করে পয়েন্টগুলির একটি সেটকে রঙ করে:
টাইপস্ক্রিপ্ট
function setStyle(/* FeatureStyleFunctionOptions */ params) { // Get the dataset feature, so we can work with all of its attributes. const datasetFeature = params.feature; // Get all of the needed dataset attributes. const furColors = datasetFeature.datasetAttributes['CombinationofPrimaryandHighlightColor']; // Apply styles. Fill is primary fur color, stroke is secondary fur color. switch (furColors) { case 'Black+': return /* FeatureStyleOptions */ { fillColor: 'black', pointRadius: 8 }; break; case 'Cinnamon+': return /* FeatureStyleOptions */ { fillColor: '#8b0000', pointRadius: 8 }; break; case 'Cinnamon+Gray': return /* FeatureStyleOptions */ { fillColor: '#8b0000', strokeColor: 'gray', pointRadius: 6 }; break; case 'Cinnamon+White': return /* FeatureStyleOptions */ { fillColor: '#8b0000', strokeColor: 'white', pointRadius: 6 }; break; case 'Gray+': return /* FeatureStyleOptions */ { fillColor: 'gray', pointRadius: 8 }; break; case 'Gray+Cinnamon': return /* FeatureStyleOptions */ { fillColor: 'gray', strokeColor: '#8b0000', pointRadius: 6 }; break; case 'Gray+Cinnamon, White': return /* FeatureStyleOptions */ { fillColor: 'silver', strokeColor: '#8b0000', pointRadius: 6 }; break; case 'Gray+White': return /* FeatureStyleOptions */ { fillColor: 'gray', strokeColor: 'white', pointRadius: 6 }; break; default: // Color not defined. return /* FeatureStyleOptions */ { fillColor: 'yellow', pointRadius: 8 }; break; } }
জাভাস্ক্রিপ্ট
function setStyle(/* FeatureStyleFunctionOptions */ params) { // Get the dataset feature, so we can work with all of its attributes. const datasetFeature = params.feature; // Get all of the needed dataset attributes. const furColors = datasetFeature.datasetAttributes["CombinationofPrimaryandHighlightColor"]; // Apply styles. Fill is primary fur color, stroke is secondary fur color. switch (furColors) { case "Black+": return /* FeatureStyleOptions */ { fillColor: "black", pointRadius: 8 }; break; case "Cinnamon+": return /* FeatureStyleOptions */ { fillColor: "#8b0000", pointRadius: 8 }; break; case "Cinnamon+Gray": return /* FeatureStyleOptions */ { fillColor: "#8b0000", strokeColor: "gray", pointRadius: 6, }; break; case "Cinnamon+White": return /* FeatureStyleOptions */ { fillColor: "#8b0000", strokeColor: "white", pointRadius: 6, }; break; case "Gray+": return /* FeatureStyleOptions */ { fillColor: "gray", pointRadius: 8 }; break; case "Gray+Cinnamon": return /* FeatureStyleOptions */ { fillColor: "gray", strokeColor: "#8b0000", pointRadius: 6, }; break; case "Gray+Cinnamon, White": return /* FeatureStyleOptions */ { fillColor: "silver", strokeColor: "#8b0000", pointRadius: 6, }; break; case "Gray+White": return /* FeatureStyleOptions */ { fillColor: "gray", strokeColor: "white", pointRadius: 6, }; break; default: // Color not defined. return /* FeatureStyleOptions */ { fillColor: "yellow", pointRadius: 8 }; break; } }
ডেটাসেট ফিচার লেয়ারে স্টাইল প্রয়োগ করুন
ফিচার স্টাইল ফাংশনে স্টাইলগুলি প্রয়োগ করতে:
-
map.getDatasetFeatureLayer()কল করে, ডেটাসেট আইডি পাস করে ডেটাসেট বৈশিষ্ট্য স্তরটি পান। - ডেটাসেট স্তরে বৈশিষ্ট্য শৈলী বিকল্পগুলি (যেমন
styleOptions) বা ফাংশন (যেমনsetStyle) সেট করে শৈলী প্রয়োগ করুন।
টাইপস্ক্রিপ্ট
const datasetLayer = map.getDatasetFeatureLayer(datasetId); datasetLayer.style = styleOptions;
জাভাস্ক্রিপ্ট
const datasetLayer = map.getDatasetFeatureLayer(datasetId); datasetLayer.style = styleOptions;
একটি স্তর থেকে স্টাইলিং সরান
একটি স্তর থেকে স্টাইলিং অপসারণ করতে, style null এ সেট করুন:
featureLayer.style = null;
আপনি আপনার ফিচার স্টাইল ফাংশন থেকে null ও ফেরত দিতে পারেন, উদাহরণস্বরূপ, যদি আপনি চান যে বৈশিষ্ট্যগুলির একটি উপসেট অদৃশ্য থাকুক।
অ্যাট্রিবিউশন টেক্সট যোগ করুন
গুগল ম্যাপে আপলোড করা ডেটাসেটগুলি প্রদর্শনের সময় আপনার মানচিত্রে অবশ্যই প্রয়োজনীয় অ্যাট্রিবিউশন(গুলি) প্রদর্শন করতে হবে। অ্যাট্রিবিউশন টেক্সট যেন গুগল লোগোকে অস্পষ্ট বা বাধাগ্রস্ত না করে।
অ্যাট্রিবিউশন টেক্সট যোগ করার একটি উপায় হল কাস্টম কন্ট্রোল ব্যবহার করে ম্যাপে স্ট্যান্ডার্ড পজিশনে ইচ্ছামত HTML স্থাপন করা। নিম্নলিখিত কোড উদাহরণে একটি ফাংশন দেখানো হয়েছে যা প্রোগ্রাম্যাটিকভাবে এমন একটি কাস্টম কন্ট্রোল তৈরি করে:
টাইপস্ক্রিপ্ট
function createAttribution(map) { const attributionLabel = document.createElement('div'); // Define CSS styles. attributionLabel.style.backgroundColor = '#fff'; attributionLabel.style.opacity = '0.7'; attributionLabel.style.fontFamily = 'Roboto,Arial,sans-serif'; attributionLabel.style.fontSize = '10px'; attributionLabel.style.padding = '2px'; attributionLabel.style.margin = '2px'; attributionLabel.textContent = 'Data source: NYC Open Data'; return attributionLabel; }
জাভাস্ক্রিপ্ট
function createAttribution(map) { const attributionLabel = document.createElement("div"); // Define CSS styles. attributionLabel.style.backgroundColor = "#fff"; attributionLabel.style.opacity = "0.7"; attributionLabel.style.fontFamily = "Roboto,Arial,sans-serif"; attributionLabel.style.fontSize = "10px"; attributionLabel.style.padding = "2px"; attributionLabel.style.margin = "2px"; attributionLabel.textContent = "Data source: NYC Open Data"; return attributionLabel; }
একবার নিয়ন্ত্রণ সংজ্ঞায়িত হয়ে গেলে, আপনি এটিকে আরম্ভের সময় মানচিত্রে যুক্ত করতে পারেন, যেমনটি এখানে দেখানো হয়েছে:
টাইপস্ক্রিপ্ট
// Create an attribution DIV and add the attribution to the map. const attributionDiv = document.createElement('div'); const attributionControl = createAttribution(map); attributionDiv.appendChild(attributionControl); map.controls[google.maps.ControlPosition.LEFT_BOTTOM].push(attributionDiv);
জাভাস্ক্রিপ্ট
// Create an attribution DIV and add the attribution to the map. const attributionDiv = document.createElement("div"); const attributionControl = createAttribution(map); attributionDiv.appendChild(attributionControl); map.controls[google.maps.ControlPosition.LEFT_BOTTOM].push(attributionDiv);

