

ImageCollection 的圖片可以動畫或一系列縮圖 (稱為「幻燈片」) 的形式呈現。這些方法可快速評估 ImageCollection 的內容,並有效呈現時空變化 (圖 1)。
getVideoThumbURL()會生成一系列動畫圖片getFilmstripThumbURL()會產生一系列縮圖
以下各節將說明如何準備 ImageCollection 進行視覺化、提供各個集合視覺化方法的程式碼範例,並介紹幾種進階動畫技術。
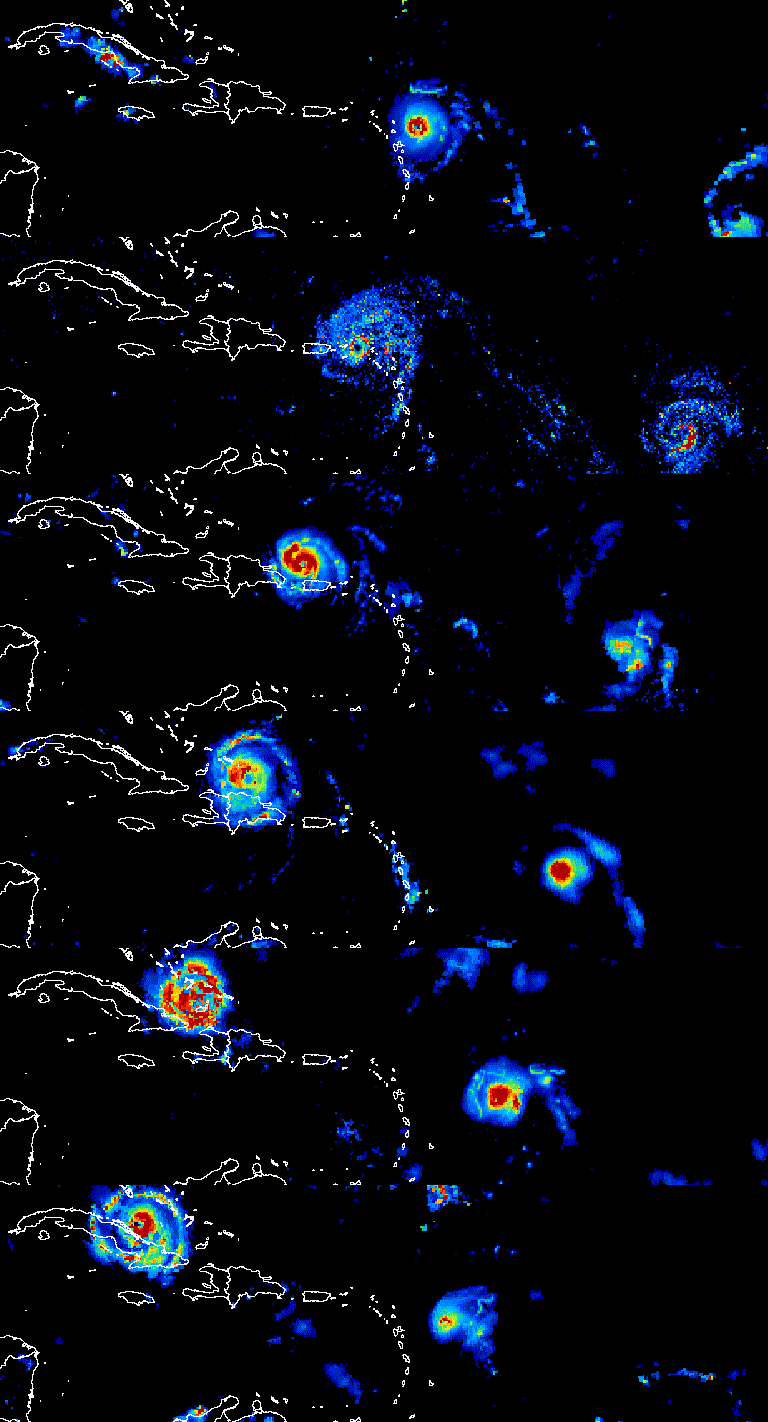
圖 1. 動畫:顯示 2017 年 9 月大西洋颶風的三天演變過程。
收集準備
篩選、合成、排序及設定集合中的圖片樣式,只顯示感興趣的圖片或強調某個現象。任何 ImageCollection 都可以做為視覺化函式的輸入內容,但如果能考量年內和跨年日期範圍、觀測間隔、區域範圍、品質和代表性,並精心挑選集合,就能取得更好的結果。
篩選器
篩選圖片集合,只納入與視覺化目的相關的資料。請考量日期、空間範圍、品質,以及特定資料集的其他屬性。
舉例來說,您可以依下列條件篩選 Sentinel-2 地表反射率集合:
單一日期範圍
程式碼編輯器 (JavaScript)
var s2col = ee.ImageCollection('COPERNICUS/S2_SR_HARMONIZED')
  .filterDate('2018-01-01', '2019-01-01');
一年中的連續日期範圍
程式碼編輯器 (JavaScript)
var s2col = ee.ImageCollection('COPERNICUS/S2_SR_HARMONIZED')
  .filter(ee.Filter.calendarRange(171, 242, 'day_of_year'));
感興趣的區域
程式碼編輯器 (JavaScript)
var s2col = ee.ImageCollection('COPERNICUS/S2_SR_HARMONIZED')
  .filterBounds(ee.Geometry.Point(-122.1, 37.2));
或圖片屬性。
程式碼編輯器 (JavaScript)
var s2col = ee.ImageCollection('COPERNICUS/S2_SR_HARMONIZED')
  .filter(ee.Filter.lt('CLOUDY_PIXEL_PERCENTAGE', 50));
鏈結多個篩選器。
程式碼編輯器 (JavaScript)
var s2col = ee.ImageCollection('COPERNICUS/S2_SR_HARMONIZED')
  .filterDate('2018-01-01', '2019-01-01')
  .filterBounds(ee.Geometry.Point(-122.1, 37.2))
  .filter('CLOUDY_PIXEL_PERCENTAGE < 50');
複合
合成年內和跨年日期範圍,減少集合中的圖片數量並提升品質。舉例來說,假設您要建立非洲年度 NDVI 的視覺化圖表。其中一個選項是篩選 MODIS 16 天 NDVI 集合,納入所有 2018 年觀測資料。
程式碼編輯器 (JavaScript)
var ndviCol = ee.ImageCollection('MODIS/061/MOD13A2')
  .filterDate('2018-01-01', '2019-01-01')
  .select('NDVI');
透過篩選和縮減功能建立跨年度合成影像
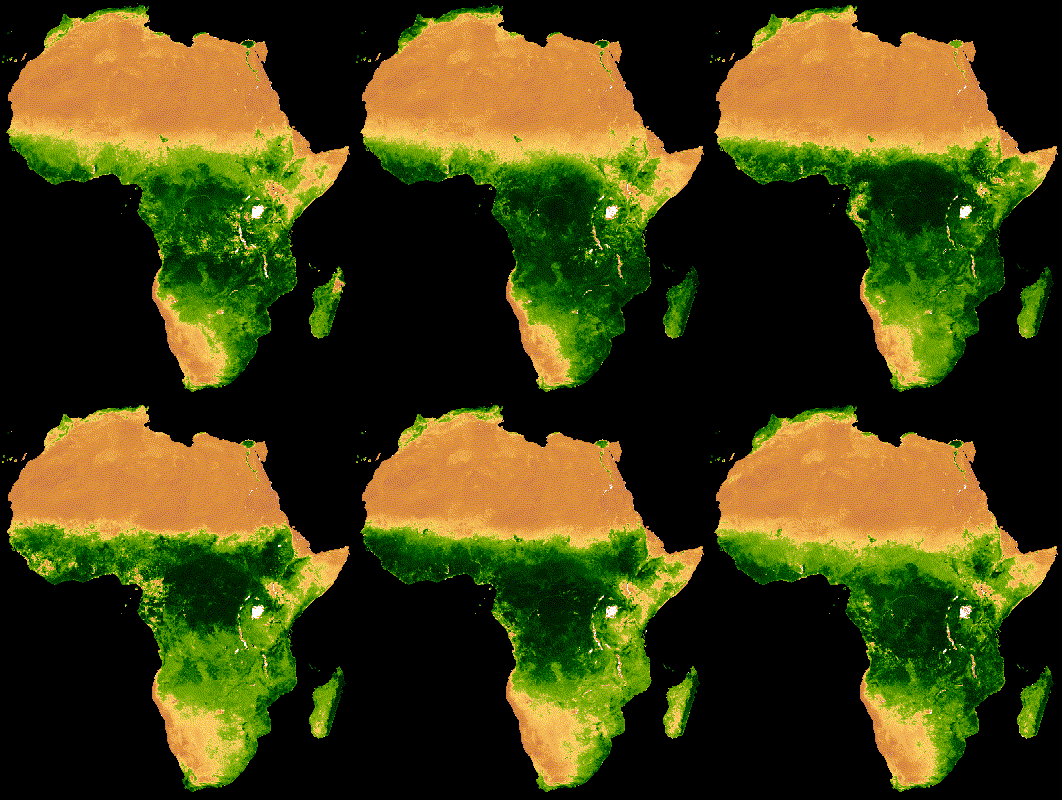
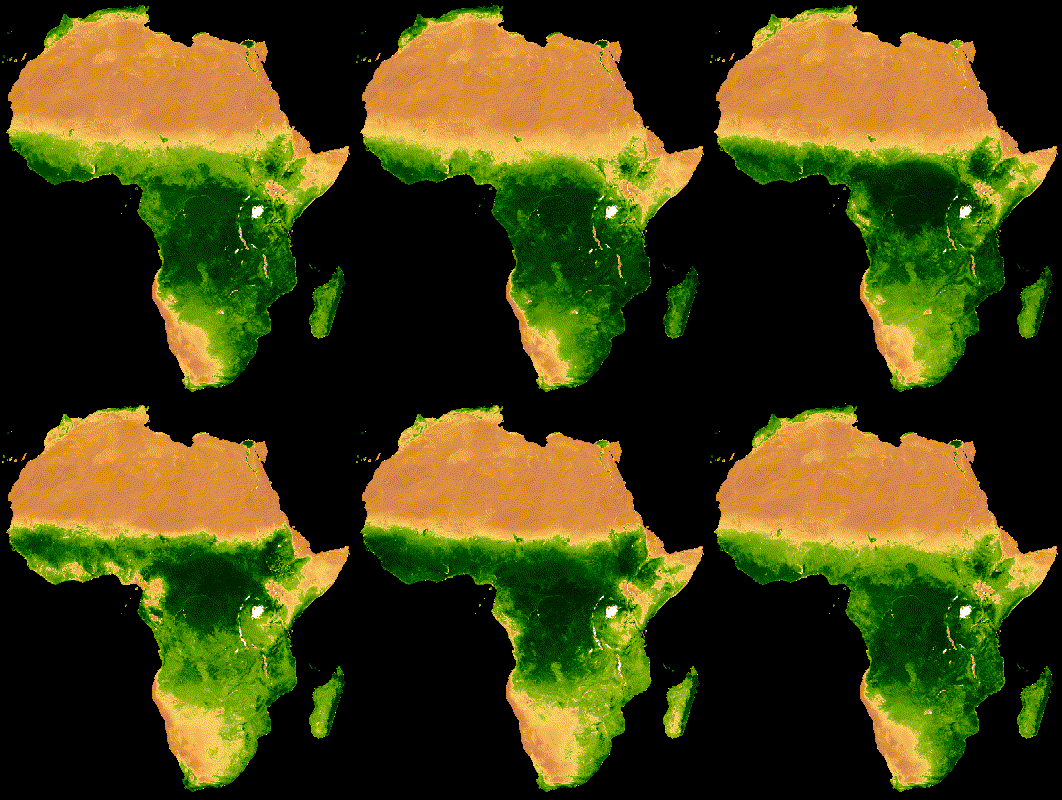
上述集合的視覺化圖表顯示,在雲層覆蓋率較高的森林區域,雜訊相當多 (圖 2a)。如要取得更準確的表示法,可以將連續日期範圍縮減為 MODIS 集合中所有年份的中位數。
程式碼編輯器 (JavaScript)
// Make a day-of-year sequence from 1 to 365 with a 16-day step.
var doyList = ee.List.sequence(1, 365, 16);

// Import a MODIS NDVI collection.
var ndviCol = ee.ImageCollection('MODIS/061/MOD13A2').select('NDVI');

// Map over the list of days to build a list of image composites.
var ndviCompList = doyList.map(function(startDoy) {
  // Ensure that startDoy is a number.
  startDoy = ee.Number(startDoy);

  // Filter images by date range; starting with the current startDate and
  // ending 15 days later. Reduce the resulting image collection by median.
  return ndviCol
    .filter(ee.Filter.calendarRange(startDoy, startDoy.add(15), 'day_of_year'))
    .reduce(ee.Reducer.median());
});

// Convert the image List to an ImageCollection.
var ndviCompCol = ee.ImageCollection.fromImages(ndviCompList);
這個集合產生的動畫雜訊較少,因為每張圖片都代表 20 多年資料中 16 天 NDVI 複合的中位數 (圖 1b)。如要進一步瞭解這個動畫,請參閱這個教學課程。
 |
 |
|---|---|
| 圖 2a. 不進行跨年度合成的年度 NDVI。 | 圖 2b. 採用年際合成的年度 NDVI。 |
透過篩選和縮減功能建立年內合成圖
上一個範例套用了跨年度合成。此外,合成一系列年內觀測資料也很有幫助。舉例來說,Landsat 資料是每十六天收集一次指定場景的感應器資料,但部分圖片通常會被雲層遮蔽。遮蓋雲層並合成同一季節的多張圖片,可以產生更清晰的圖像。請參考以下範例,其中 7 月和 8 月的 Landsat 5 圖片是使用 1985 年至 2011 年每年的中位數合成。
程式碼編輯器 (JavaScript)
// Assemble a collection of Landsat surface reflectance images for a given
// region and day-of-year range.
var lsCol = ee.ImageCollection('LANDSAT/LT05/C02/T1_L2')
  .filterBounds(ee.Geometry.Point(-122.9, 43.6))
  .filter(ee.Filter.dayOfYear(182, 243))
  // Add the observation year as a property to each image.
  .map(function(img) {
    return img.set('year', ee.Image(img).date().get('year'));
  });


// Define a function to scale the data and mask unwanted pixels.
function maskL457sr(image) {
  // Bit 0 - Fill
  // Bit 1 - Dilated Cloud
  // Bit 2 - Unused
  // Bit 3 - Cloud
  // Bit 4 - Cloud Shadow
  var qaMask = image.select('QA_PIXEL').bitwiseAnd(parseInt('11111', 2)).eq(0);
  var saturationMask = image.select('QA_RADSAT').eq(0);

  // Apply the scaling factors to the appropriate bands.
  var opticalBands = image.select('SR_B.').multiply(0.0000275).add(-0.2);
  var thermalBand = image.select('ST_B6').multiply(0.00341802).add(149.0);

  // Replace the original bands with the scaled ones and apply the masks.
  return image.addBands(opticalBands, null, true)
      .addBands(thermalBand, null, true)
      .updateMask(qaMask)
      .updateMask(saturationMask);
}

// Define a list of unique observation years from the image collection.
var years = ee.List(lsCol.aggregate_array('year')).distinct().sort();

// Map over the list of years to build a list of annual image composites.
var lsCompList = years.map(function(year) {
  return lsCol
    // Filter image collection by year.
    .filterMetadata('year', 'equals', year)
    // Apply cloud mask.
    .map(maskL457sr)
    // Reduce image collection by median.
    .reduce(ee.Reducer.median())
    // Set composite year as an image property.
    .set('year', year);
});

// Convert the image List to an ImageCollection.
var lsCompCol = ee.ImageCollection.fromImages(lsCompList);
透過彙整和縮減功能建立年內合成影像
請注意,前兩種合成方法會對應 List 的天數和年份,以逐步定義要篩選和合成的新日期。套用彙整是另一種執行這項作業的方法。在下列程式碼片段中,系統會定義不重複的年份集合,然後套用 saveAll 彙整,找出與指定年份對應的所有圖片。屬於特定年份的圖片會分組到 List 物件中,並儲存為不同年份集合中各年份代表的屬性。年度合成影像是由這些清單產生,方法是在對應至不同年份集合的函式中,減少由這些清單定義的 ImageCollections。
程式碼編輯器 (JavaScript)
// Assemble a collection of Landsat surface reflectance images for a given
// region and day-of-year range.
var lsCol = ee.ImageCollection('LANDSAT/LT05/C02/T1_L2')
  .filterBounds(ee.Geometry.Point(-122.9, 43.6))
  .filter(ee.Filter.dayOfYear(182, 243))
  // Add the observation year as a property to each image.
  .map(function(img) {
    return img.set('year', ee.Image(img).date().get('year'));
  });

// Make a distinct year collection; one image representative per year.
var distinctYears = lsCol.distinct('year').sort('year');

// Define a join filter; one-to-many join on ‘year’ property.
var filter = ee.Filter.equals({leftField: 'year', rightField: 'year'});

// Define a join.
var join = ee.Join.saveAll('year_match');

// Apply the join; results in 'year_match' property being added to each distinct
// year representative image. The list includes all images in the collection
// belonging to the respective year.
var joinCol = join.apply(distinctYears, lsCol, filter);

// Define a function to scale the data and mask unwanted pixels.
function maskL457sr(image) {
  // Bit 0 - Fill
  // Bit 1 - Dilated Cloud
  // Bit 2 - Unused
  // Bit 3 - Cloud
  // Bit 4 - Cloud Shadow
  var qaMask = image.select('QA_PIXEL').bitwiseAnd(parseInt('11111', 2)).eq(0);
  var saturationMask = image.select('QA_RADSAT').eq(0);

  // Apply the scaling factors to the appropriate bands.
  var opticalBands = image.select('SR_B.').multiply(0.0000275).add(-0.2);
  var thermalBand = image.select('ST_B6').multiply(0.00341802).add(149.0);

  // Replace the original bands with the scaled ones and apply the masks.
  return image.addBands(opticalBands, null, true)
      .addBands(thermalBand, null, true)
      .updateMask(qaMask)
      .updateMask(saturationMask);
}

// Map over the distinct years collection to build a list of annual image
// composites.
var lsCompList = joinCol.map(function(img) {
  // Get the list of images belonging to the given year.
  return ee.ImageCollection.fromImages(img.get('year_match'))
    // Apply cloud mask.
    .map(maskL457sr)
    // Reduce image collection by median.
    .reduce(ee.Reducer.median())
    // Set composite year as an image property.
    .copyProperties(img, ['year']);
});

// Convert the image List to an ImageCollection.
var lsCompCol = ee.ImageCollection(lsCompList);
透過 join 和 reduce 函式建立當天合成影像
合成的另一個用途是建立空間連續的馬賽克圖片。假設您感興趣的區域橫跨同一路徑中的兩個 Landsat 列,而您的目標是顯示 2017 年和 2018 年每個 Landsat 8 軌道的兩張圖片的馬賽克圖片。在這裡,依路徑和資料列篩選集合後,系統會使用彙整作業,將同一軌道 (依擷取日期定義) 的 Landsat 圖片拼接在一起。
程式碼編輯器 (JavaScript)
var lsCol = ee.ImageCollection('LANDSAT/LC08/C02/T1_L2')
  .filterDate('2017-01-01', '2019-01-01')
  .filter('WRS_PATH == 38 && (WRS_ROW == 28 || WRS_ROW == 29)')
  .map(function(img) {
    var date = img.date().format('yyyy-MM-dd');
    return img.set('date', date);
  });

var distinctDates = lsCol.distinct('date').sort('date');
var filter = ee.Filter.equals({leftField: 'date', rightField: 'date'});
var join = ee.Join.saveAll('date_match');
var joinCol = join.apply(distinctDates, lsCol, filter);

var lsColMos = ee.ImageCollection(joinCol.map(function(col) {
  return ee.ImageCollection.fromImages(col.get('date_match')).mosaic();
}));
排序
依時間排序集合,確保時間順序正確,或依所選屬性排序。根據預設,視覺化框架序列會按照集合的自然順序排序。您可以使用 sort 集合方法,選取 Image 屬性,並按照遞增或遞減順序排序,藉此變更數列的排列方式。例如,如要依觀測時間排序,請使用常見的 system:time_start 屬性。
程式碼編輯器 (JavaScript)
var s2col = ee.ImageCollection('COPERNICUS/S2_SR_HARMONIZED')
  .filterBounds(ee.Geometry.Point(-122.1, 37.2))
  .sort('system:time_start');
或者,也可以按照雲量遞增的順序定義,例如這個 Sentinel-2 圖像。
程式碼編輯器 (JavaScript)
var s2col = ee.ImageCollection('COPERNICUS/S2_SR_HARMONIZED')
  .filterBounds(ee.Geometry.Point(-122.1, 37.2))
  .sort('CLOUDY_PIXEL_PERCENTAGE');
也可以透過衍生資源 (例如區域 NDVI 平均值) 定義順序。在這裡,區域 NDVI 會做為屬性,新增至對應函式中的每張圖片,然後依新屬性排序。
程式碼編輯器 (JavaScript)
// Define an area of interest geometry.
var aoi = ee.Geometry.Point(-122.1, 37.2).buffer(1e4);

// Filter MODIS NDVI image collection by a date range.
var ndviCol = ee.ImageCollection('MODIS/061/MOD13A1')
  .filterDate('2018-01-01', '2019-01-01')
  .select('NDVI')
  // Map over the image collection to calculate regional mean NDVI and add
  // the result to each image as a property.
  .map(function(img) {
    var meanNdvi = img.reduceRegion({
      reducer: ee.Reducer.mean(), geometry: aoi, scale: 500});
    return img.set('meanNdvi', meanNdvi.get('NDVI'));
  })
  // Sort the collection by descending regional mean NDVI.
  .sort('meanNdvi', false);
圖片視覺化
圖片視覺化功能可將數字轉換為顏色。在集合視覺化方法中,有三種方式可以控制圖片資料如何以顏色呈現:
- 直接向
getVideoThumbURL和getFilmstripThumbURL提供視覺化引數。 - 在套用
getVideoThumbURL和getFilmstripThumbURL之前,先將visualize圖片方法對應至圖片集合。 - 在套用
getVideoThumbURL和getFilmstripThumbURL之前,先將sldStyle圖片方法對應至圖片集合。詳情請參閱「樣式圖層描述元」。
本指南中的範例使用選項 1 和 2,其中視覺化是透過將多波段圖片的三個圖片波段對應至紅色、綠色和藍色色彩通道,或沿著調色盤線性分級單一波段的值來達成。視覺化參數包括:
| 參數 | 說明 | 類型 |
|---|---|---|
| 頻帶 | 以半形逗號分隔的三個波段名稱清單,用於對應至 RGB | list |
| min | 要對應至 0 的值 | 數字或三個數字的清單,每個波段一個 |
| max | 要對應至 255 的值 | 數字或三個數字的清單,每個波段一個 |
| gain | 每個像素值要乘以的值 | 數字或三個數字的清單,每個波段一個 |
| 偏差 | 要新增至各 DN 的值 | 數字或三個數字的清單,每個波段一個 |
| gamma | Gamma 修正係數 | 數字或三個數字的清單,每個波段一個 |
| palette | CSS 樣式顏色字串清單 (僅限單波段圖片) | 以半形逗號分隔的十六進位字串清單 |
| opacity | 圖層的不透明度 (0.0 為完全透明,1.0 為完全不透明) | 數字 |
使用 bands 引數選取要以圖表呈現的波段。請提供一或三個頻帶名稱的清單。如果是多波段圖片,系統預設會選取前三個波段。波段名稱順序決定顏色指派;第一個、第二個和第三個列出的波段分別對應到紅色、綠色和藍色。
以圖表呈現圖片時,資料範圍縮放是重要考量。根據預設,介於 0 和 1 (含) 之間的浮點資料值會縮放至 0 和 255 (含) 之間。超出這個範圍的值會強制設為 0 和 255,具體取決於值是否分別小於 0 或大於 1。對於整數資料,其類型定義的完整容量會縮放至 0 到 255 之間 (例如,有正負號的 16 位元資料範圍為 -32,768 到 32,767,預設會縮放至 [0, 255])。如果接受預設值,通常會導致圖像特徵之間幾乎沒有對比度。使用 min 和 max 提高對比度,並強調特定資料範圍。根據經驗法則,建議將 min 和 max 設為代表感興趣區域內資料第 2 和第 98 個百分位數的值。請參閱以下範例,瞭解如何計算數位高程模型的這些值。
程式碼編輯器 (JavaScript)
// Import NASADEM global elevation model.
var demImg = ee.Image('NASA/NASADEM_HGT/001').select('elevation');

// Define a rectangular area of interest.
var aoi = ee.Geometry.Polygon(
  [[
    [-103.84153083119054, 49.083004219142886],
    [-103.84153083119054, 25.06838270664608],
    [-85.64817145619054, 25.06838270664608],
    [-85.64817145619054, 49.083004219142886]
  ]],
  null, false);

// Calculate the 2nd and 98th percentile elevation values from rescaled (to
// 500m) pixels intersecting the area of interest. A Dictionary is returned.
var percentClip = demImg.reduceRegion({
  reducer: ee.Reducer.percentile([2, 98]),
  geometry: aoi,
  scale: 500,
  maxPixels: 3e7
});

// Print the regional 2nd and 98th percentile elevation values. Get the
// dictionary keys and use them to get the values for each percentile summary.
var keys = percentClip.keys();
print('Set vis min to:', ee.Number(percentClip.get(keys.get(0))).round());
print('Set vis max to:', ee.Number(percentClip.get(keys.get(1))).round());
palette 參數定義了代表 8 位元視覺化圖片的顏色。僅適用於單一波段表示法;如果指定多波段圖片,會發生錯誤。如果資料是單一波段,或您想以視覺化方式呈現多波段圖片中的單一波段,請將 forceRgbOutput 參數設為 true (如果提供 palette 引數,則不需要)。使用 min 和 max 參數,定義 0 到 255 之間線性縮放的值範圍。
以下範例說明如何將視覺化函式對應至單一波段圖片集合。匯入 MODIS NDVI 集合,設定 visualization 方法的視覺化引數,並將值轉換為 RGB 圖片表示法的函式對應至 NDVI 集合。
程式碼編輯器 (JavaScript)
// Filter MODIS NDVI image collection by a date range.
var ndviCol = ee.ImageCollection('MODIS/061/MOD13A1')
  .filterDate('2018-01-01', '2019-01-01')
  .select('NDVI');

// Define visualization arguments.
var visArgs = {
  min: 0,
  max: 9000,
  palette: [
    'FFFFFF', 'CE7E45', 'DF923D', 'F1B555', 'FCD163', '99B718', '74A901',
    '66A000', '529400', '3E8601', '207401', '056201', '004C00', '023B01',
    '012E01', '011D01', '011301'
  ]
};

// Define a function to convert an image to an RGB visualization image and copy
// properties from the original image to the RGB image.
var visFun = function(img) {
  return img.visualize(visArgs).copyProperties(img, img.propertyNames());
};

// Map over the image collection to convert each image to an RGB visualization
// using the previously defined visualization function.
var ndviColVis = ndviCol.map(visFun);
以下範例說明如何將視覺化函式對應至多波段圖片集合:
程式碼編輯器 (JavaScript)
// Assemble a collection of Sentinel-2 surface reflectance images for a given
// region and date range.
var s2col = ee.ImageCollection('COPERNICUS/S2_SR_HARMONIZED')
  .filterBounds(ee.Geometry.Point(-96.9037, 48.0395))
  .filterDate('2019-06-01', '2019-10-01');

// Define visualization arguments.
var visArgs = {bands: ['B11', 'B8', 'B3'], min: 300, max: 3500};

// Define a function to convert an image to an RGB visualization image and copy
// properties from the original image to the RGB image.
var visFun = function(img) {
  return img.visualize(visArgs).copyProperties(img, img.propertyNames());
};

// Map over the image collection to convert each image to an RGB visualization
// using the previously defined visualization function.
var s2colVis = s2col.map(visFun);
在本例中,由於提供了三個波段,因此未提供調色盤引數,這些波段會定義每個 RGB 圖層的強度。請注意,這兩個範例都使用 min 和 max 參數,控制要將哪些值延伸至 8 位元 RGB 資料的極限。
影片縮圖
getVideoThumbURL() 函式會根據 ImageCollection 中的所有圖片產生動畫,其中每張圖片代表一個影格。製作動畫的一般工作流程如下:
- 定義
Geometry,其邊界會決定動畫的區域範圍。 - 定義
ImageCollection。 - 請考慮圖片視覺化:將圖片視覺化函式對應至集合,或將圖片視覺化引數新增至動畫引數組合。
- 定義動畫引數並呼叫
getVideoThumbURL方法。
getVideoThumbURL 的結果是網址。將網址輸出至控制台,然後點選網址,讓 Earth Engine 伺服器在新的瀏覽器分頁中即時生成動畫。或者,您也可以在集合和對應的動畫引數上呼叫 ui.Thumbnail 函式,在程式碼編輯器控制台中查看動畫。算繪完成後,只要在動畫上按一下滑鼠右鍵,並從內容選單中選取適當選項,即可下載動畫。
以下範例說明如何生成動畫,呈現 24 小時內的全球氣溫變化。請注意,這個範例包含視覺化引數和動畫引數,而不是先在 ImageCollection 上對應視覺化函式。執行這個指令碼後,程式碼編輯器控制台中應會顯示類似圖 3 的動畫。
程式碼編輯器 (JavaScript)
// Define an area of interest geometry with a global non-polar extent.
var aoi = ee.Geometry.Polygon(
  [[[-179.0, 78.0], [-179.0, -58.0], [179.0, -58.0], [179.0, 78.0]]], null,
  false);

// Import hourly predicted temperature image collection for northern winter
// solstice. Note that predictions extend for 384 hours; limit the collection
// to the first 24 hours.
var tempCol = ee.ImageCollection('NOAA/GFS0P25')
  .filterDate('2018-12-22', '2018-12-23')
  .limit(24)
  .select('temperature_2m_above_ground');

// Define arguments for animation function parameters.
var videoArgs = {
  dimensions: 768,
  region: aoi,
  framesPerSecond: 7,
  crs: 'EPSG:3857',
  min: -40.0,
  max: 35.0,
  palette: ['blue', 'purple', 'cyan', 'green', 'yellow', 'red']
};

// Print the animation to the console as a ui.Thumbnail using the above defined
// arguments. Note that ui.Thumbnail produces an animation when the first input
// is an ee.ImageCollection instead of an ee.Image.
print(ui.Thumbnail(tempCol, videoArgs));

// Alternatively, print a URL that will produce the animation when accessed.
print(tempCol.getVideoThumbURL(videoArgs));
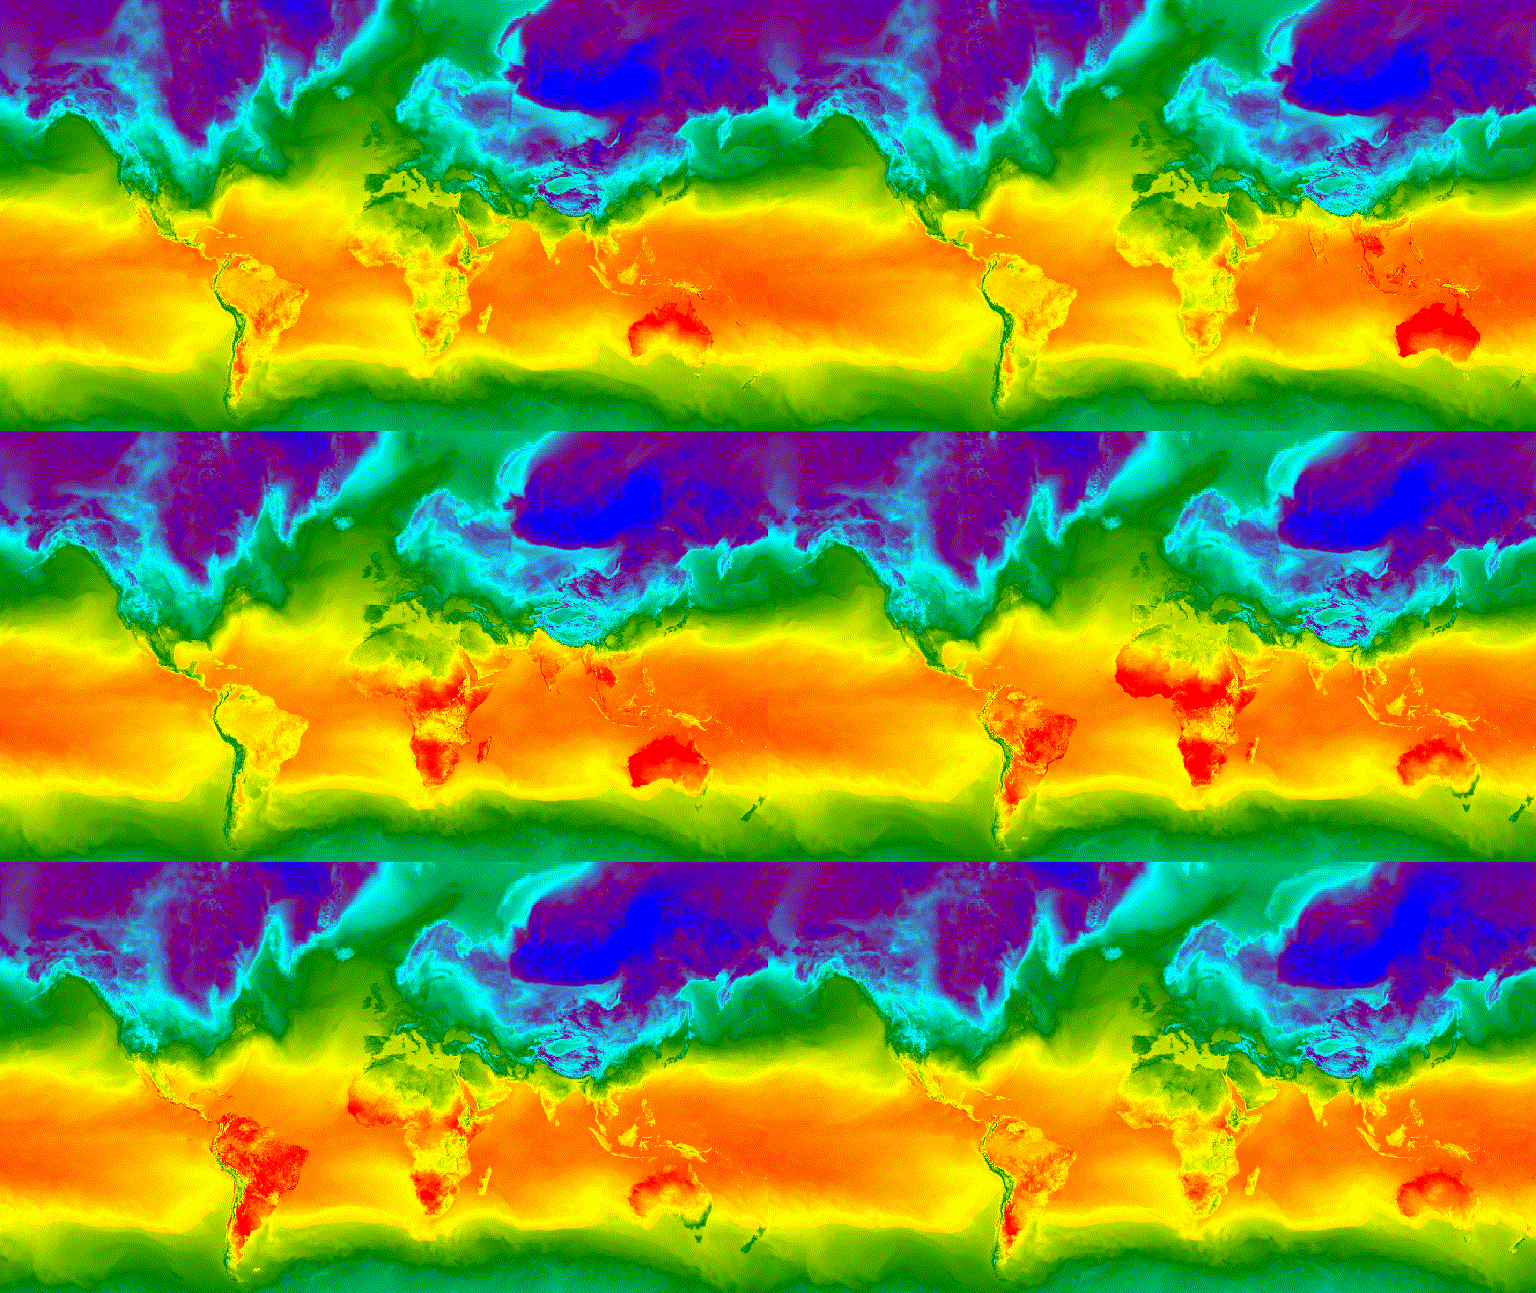
圖 3. 北半球冬至的每小時地表溫度,以 GIF 動畫圖片呈現。
剪輯畫面
getFilmstripThumbUrl 函式會產生單一靜態圖片
,代表 ImageCollection 中所有圖片串連成
南北系列。縮圖列影格的順序會遵循集合的自然順序。
getFilmstripThumbUrl 的結果是網址。將網址輸出至控制台,然後點選網址,讓 Earth Engine 伺服器在新的瀏覽器分頁中即時生成圖片。算繪完成後,只要在圖片上按一下滑鼠右鍵,並從內容選單中選取適當選項,即可下載圖片。
下列程式碼片段使用的集合與上述影片縮圖範例相同。執行這個指令碼後,程式碼編輯器控制台中應會顯示類似圖 4 的縮圖列。
程式碼編輯器 (JavaScript)
// Define an area of interest geometry with a global non-polar extent.
var aoi = ee.Geometry.Polygon(
  [[[-179.0, 78.0], [-179.0, -58.0], [179.0, -58.0], [179.0, 78.0]]], null,
  false);

// Import hourly predicted temperature image collection for northern winter
// solstice. Note that predictions extend for 384 hours; limit the collection
// to the first 24 hours.
var tempCol = ee.ImageCollection('NOAA/GFS0P25')
  .filterDate('2018-12-22', '2018-12-23')
  .limit(24)
  .select('temperature_2m_above_ground');

// Define arguments for the getFilmstripThumbURL function parameters.
var filmArgs = {
  dimensions: 128,
  region: aoi,
  crs: 'EPSG:3857',
  min: -40.0,
  max: 35.0,
  palette: ['blue', 'purple', 'cyan', 'green', 'yellow', 'red']
};

// Print a URL that will produce the filmstrip when accessed.
print(tempCol.getFilmstripThumbURL(filmArgs));
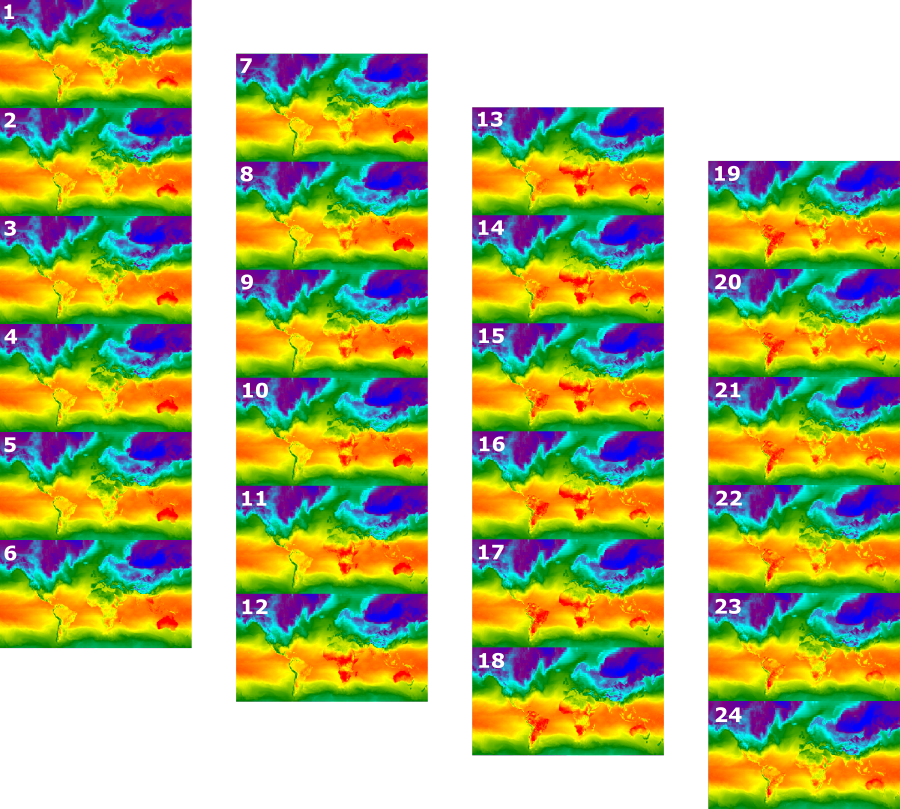
圖 4. 北半球冬至每小時地表溫度的 PNG 圖片,以幻燈片形式呈現。請注意,縮圖列已分成四個部分顯示;getFilmstripThumbURL 的結果是南北向相連的一系列集合圖片。
進階技巧
以下各節將說明如何使用裁剪、不透明度和圖層合成功能,新增多邊形邊框、強調感興趣的區域,以及比較集合中的圖片,進而強化視覺效果。
請注意,本節中的所有範例都使用此處定義的相同基本 ImageCollection:
程式碼編輯器 (JavaScript)
// Import hourly predicted temperature image collection for northern winter
// solstice. Note that predictions extend for 384 hours; limit the collection
// to the first 24 hours.
var tempCol = ee.ImageCollection('NOAA/GFS0P25')
  .filterDate('2018-12-22', '2018-12-23')
  .limit(24)
  .select('temperature_2m_above_ground');

// Define visualization arguments to control the stretch and color gradient
// of the data.
var visArgs = {
  min: -40.0,
  max: 35.0,
  palette: ['blue', 'purple', 'cyan', 'green', 'yellow', 'red']
};

// Convert each image to an RGB visualization image by mapping the visualize
// function over the image collection using the arguments defined previously.
var tempColVis = tempCol.map(function(img) {
  return img.visualize(visArgs);
});

// Import country features and filter to South American countries.
var southAmCol = ee.FeatureCollection('USDOS/LSIB_SIMPLE/2017')
  .filterMetadata('wld_rgn', 'equals', 'South America');

// Define animation region (South America with buffer).
var southAmAoi = ee.Geometry.Rectangle({
  coords: [-103.6, -58.8, -18.4, 17.4], geodesic: false});
重疊說明
您可以使用 blend Image 方法疊加多張圖片,系統會根據遮罩 (不透明度) 混合兩張圖片的重疊像素。
向量疊加
在圖片中加入行政邊界多邊形和其他幾何圖形,可提供實用的空間背景資訊。請參考上方的全球每日地表溫度動畫 (圖 3)。陸地和海洋之間的界線大致可辨,但只要加入國家/地區的多邊形疊加層,就能更清楚地呈現。
向量資料 (Features) 會透過套用 paint 方法繪製成圖片。您可以將特徵繪製到現有圖片上,但更好的做法是將特徵繪製到空白圖片上、設定樣式,然後將結果與其他樣式圖片圖層混合。獨立處理視覺化堆疊的每個層,可進一步控管樣式。
以下範例示範如何將南美洲國家/地區邊界繪製到空白 Image,並將結果與全球每日溫度集合的每個 Image 混合 (圖 5)。疊加的國家/地區邊界可區分陸地和水域,並提供溫度模式的背景資訊。
程式碼編輯器 (JavaScript)
// Define an empty image to paint features to.
var empty = ee.Image().byte();

// Paint country feature edges to the empty image.
var southAmOutline = empty
  .paint({featureCollection: southAmCol, color: 1, width: 1})
  // Convert to an RGB visualization image; set line color to black.
  .visualize({palette: '000000'});

// Map a blend operation over the temperature collection to overlay the country
// border outline image on all collection images.
var tempColOutline = tempColVis.map(function(img) {
  return img.blend(southAmOutline);
});

// Define animation arguments.
var videoArgs = {
  dimensions: 768,
  region: southAmAoi,
  framesPerSecond: 7,
  crs: 'EPSG:3857'
};

// Display the animation.
print(ui.Thumbnail(tempColOutline, videoArgs));
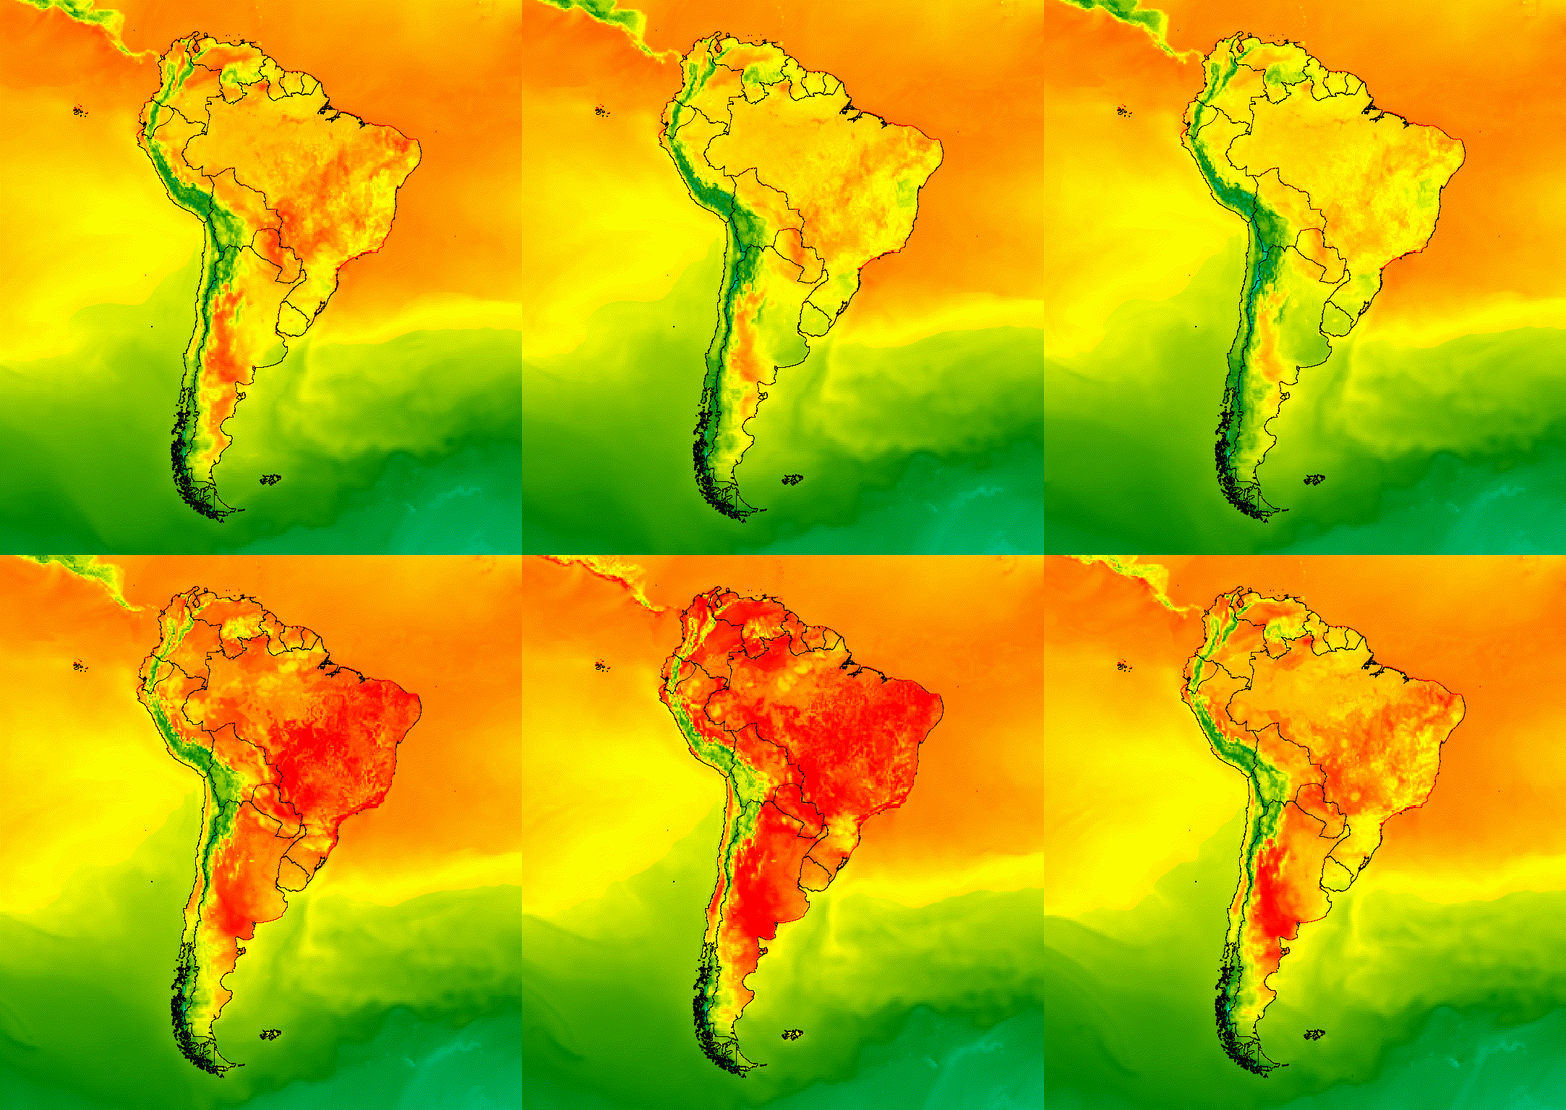
圖 5. 在集合中的圖片上新增向量疊加層,提供空間背景資訊。
圖片重疊
您可以疊加多張圖片,達到所需風格。假設您想強調感興趣的區域,您可以建立圖片視覺化圖表的靜音副本做為基礎圖層,然後疊加原始視覺化圖表的剪輯版本。接續上一個範例,下列指令碼會產生圖 6。
程式碼編輯器 (JavaScript)
// Define an empty image to paint features to.
var empty = ee.Image().byte();

// Paint country feature edges to the empty image.
var southAmOutline = empty
  .paint({featureCollection: southAmCol, color: 1, width: 1})
  // Convert to an RGB visualization image; set line color to black.
  .visualize({palette: '000000'});

// Map a blend operation over the temperature collection to overlay the country
// border outline image on all collection images.
var tempColOutline = tempColVis.map(function(img) {
  return img.blend(southAmOutline);
});

// Define a partially opaque grey RGB image to dull the underlying image when
// blended as an overlay.
var dullLayer = ee.Image.constant(175).visualize({
  opacity: 0.6, min: 0, max: 255, forceRgbOutput: true});

// Map a two-part blending operation over the country outline temperature
// collection for final styling.
var finalVisCol = tempColOutline.map(function(img) {
  return img
    // Blend the dulling layer with the given country outline temperature image.
    .blend(dullLayer)
    // Blend a clipped copy of the country outline temperature image with the
    // dulled background image.
    .blend(img.clipToCollection(southAmCol));
});

// Define animation arguments.
var videoArgs = {
  dimensions: 768,
  region: southAmAoi,
  framesPerSecond: 7,
  crs: 'EPSG:3857'
};

// Display the animation.
print(ui.Thumbnail(finalVisCol, videoArgs));
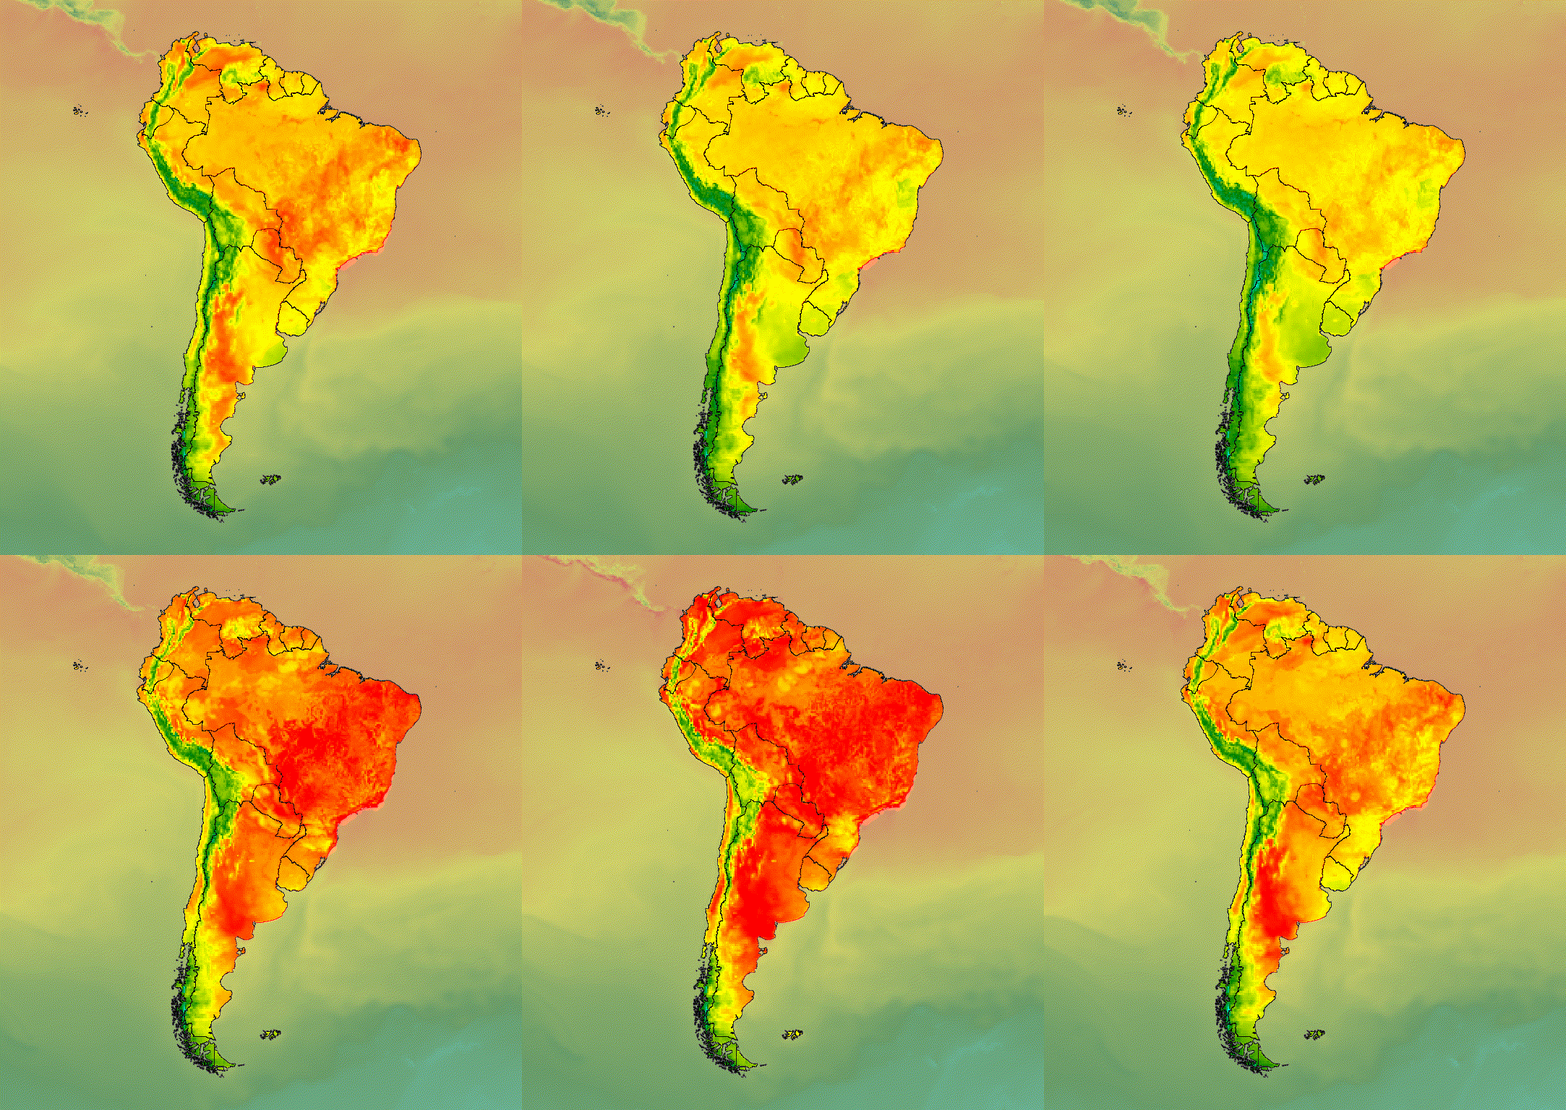
圖 6. 剪輯圖片並疊加在靜音副本上,強調感興趣的區域。
您也可以將圖片資料與山體陰影基本圖層混合,以指出地形並為視覺化內容提供一些深度 (圖 7)。
程式碼編輯器 (JavaScript)
// Define a hillshade layer from NASADEM digital elevation model.
var hillshade = ee.Terrain.hillshade(ee.Image('NASA/NASADEM_HGT/001')
  // Exaggerate the elevation to increase contrast in hillshade.
  .multiply(100))
  // Clip the DEM by South American boundary to clean boundary between
  // land and ocean.
  .clipToCollection(southAmCol);

// Map a blend operation over the temperature collection to overlay a partially
// opaque temperature layer on the hillshade layer.
var finalVisCol = tempColVis.map(function(img) {
  return hillshade
    .blend(img.clipToCollection(southAmCol).visualize({opacity: 0.6}));
});

// Define animation arguments.
var videoArgs = {
  dimensions: 768,
  region: southAmAoi,
  framesPerSecond: 7,
  crs: 'EPSG:3857'
};

// Display the animation.
print(ui.Thumbnail(finalVisCol, videoArgs));
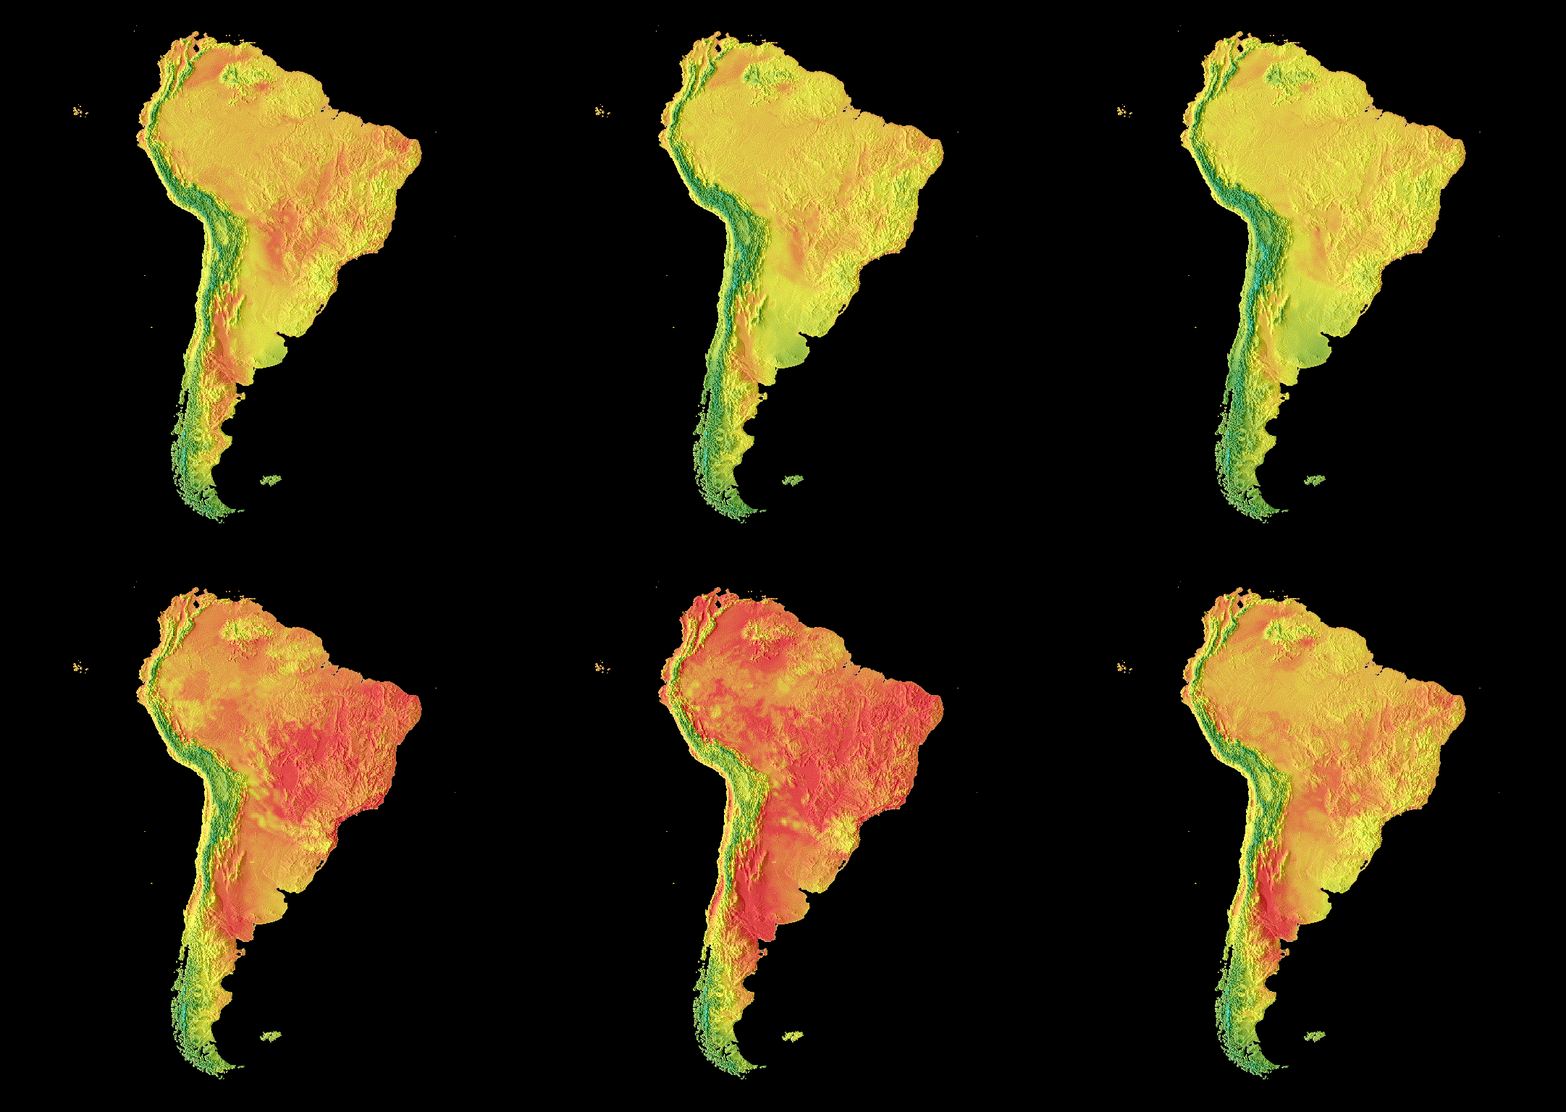
圖 7. 在暈渲圖層上疊加部分透明的圖片資料,即可顯示地形。
轉場
自訂圖片集合,製作動畫,使用淡出、閃爍和滑動轉場效果,呈現集合中兩張圖片之間的差異。下列範例皆使用由以下指令碼產生的相同基本圖表:
程式碼編輯器 (JavaScript)
// Define an area of interest geometry with a global non-polar extent.
var aoi = ee.Geometry.Polygon(
  [[[-179.0, 78.0], [-179.0, -58.0], [179.0, -58.0], [179.0, 78.0]]], null,
  false);

// Import hourly predicted temperature image collection.
var temp = ee.ImageCollection('NOAA/GFS0P25')

// Define a northern summer solstice temperature image.
var summerSolTemp = temp
  .filterDate('2018-06-21', '2018-06-22')
  .filterMetadata('forecast_hours', 'equals', 12)
  .first()
  .select('temperature_2m_above_ground');

// Define a northern winter solstice temperature image.
var winterSolTemp = temp
  .filterDate('2018-12-22', '2018-12-23')
  .filterMetadata('forecast_hours', 'equals', 12)
  .first()
  .select('temperature_2m_above_ground');

// Combine the solstice images into a collection.
var tempCol = ee.ImageCollection([
  summerSolTemp.set('season', 'summer'),
  winterSolTemp.set('season', 'winter')
]);

// Import international boundaries feature collection.
var countries = ee.FeatureCollection('USDOS/LSIB_SIMPLE/2017');

// Define visualization arguments.
var visArgs = {
  min: -40.0,
  max: 35.0,
  palette: ['blue', 'purple', 'cyan', 'green', 'yellow', 'red']
};

// Convert the image data to RGB visualization images.
// The clip and unmask combination sets ocean pixels to black.
var tempColVis = tempCol.map(function(img) {
  return img
    .visualize(visArgs)
    .clipToCollection(countries)
    .unmask(0)
    .copyProperties(img, img.propertyNames());
});
閃爍
如果精選輯中只有兩張圖片 (如本例所示),閃爍是精選輯動畫的預設呈現方式。調整 framesPerSecond 動畫引數,加快或減慢閃爍速率。將下列視覺化引數套用至上述集合,即可產生圖 8。
程式碼編輯器 (JavaScript)
// Define arguments for animation function parameters.
var videoArgs = {
  dimensions: 768,
  region: aoi,
  framesPerSecond: 2,
  crs: 'EPSG:3857'
};

// Display animation to the Code Editor console.
print(ui.Thumbnail(tempColVis, videoArgs));
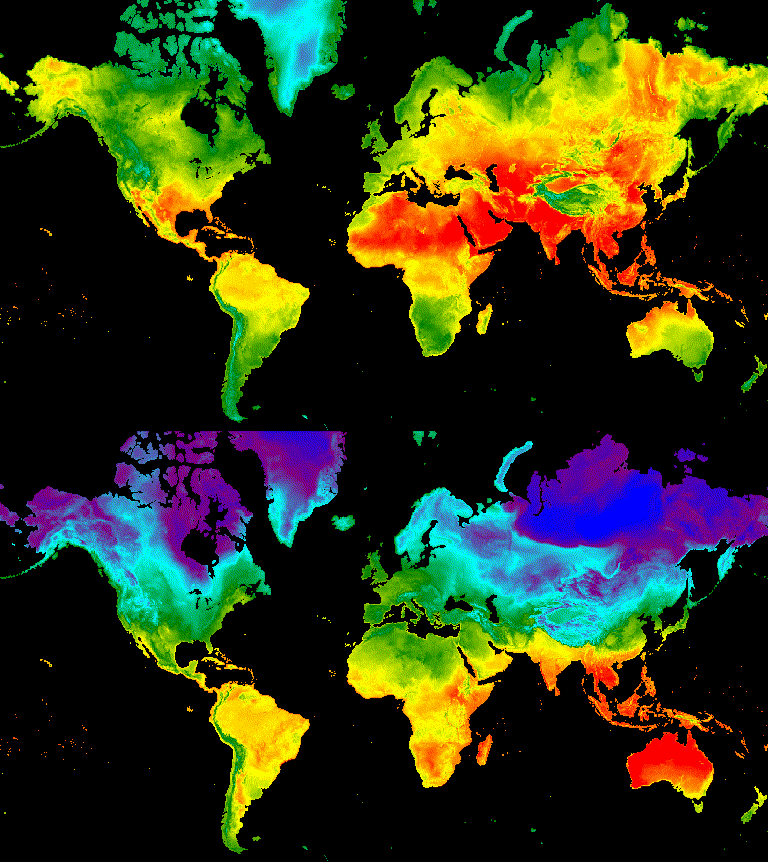
圖 8. 範例:北半球夏至和冬至格林威治標準時間中午 12 點的地表溫度閃爍。
淡出
如要讓兩個圖層之間呈現淡出轉場效果,請同時降低其中一個圖層的不透明度,並提高另一個圖層的不透明度,不透明度增量序列從接近 0 到 1 (圖 9)。
程式碼編輯器 (JavaScript)
// Define a sequence of decreasing opacity increments. Note that opacity cannot
// be 0, so near 1 and 0 are used. Near 1 is needed because a compliment is
// calculated in a following step that can result in 0 if 1 is an element of the
// list.
var opacityList = ee.List.sequence({start: 0.99999, end: 0.00001, count: 20});

// Filter the summer and winter solstice images from the collection and set as
// image objects.
var summerImg = tempColVis.filter(ee.Filter.eq('season', 'summer')).first();
var winterImg = tempColVis.filter(ee.Filter.eq('season', 'winter')).first();

// Map over the list of opacity increments to iteratively adjust the opacity of
// the two solstice images. Returns a list of images.
var imgList = opacityList.map(function(opacity) {
  var opacityCompliment = ee.Number(1).subtract(ee.Number(opacity));
  var winterImgFade = winterImg.visualize({opacity: opacity});
  var summerImgFade = summerImg.visualize({opacity: opacityCompliment});
  return summerImgFade.blend(winterImgFade).set('opacity', opacity);
});

// Convert the image list to an image collection; the forward phase.
var fadeForward = ee.ImageCollection.fromImages(imgList);

// Make a copy of the collection that is sorted by ascending opacity to
// represent the reverse phase.
var fadeBackward = fadeForward.sort({property: 'opacity'});

// Merge the forward and reverse phase frame collections.
var fadeCol = fadeForward.merge(fadeBackward);

// Define animation arguments.
var videoArgs = {
  dimensions: 768,
  region: aoi,
  framesPerSecond: 25,
  crs: 'EPSG:3857'
};

// Display the animation.
print(ui.Thumbnail(fadeCol, videoArgs));
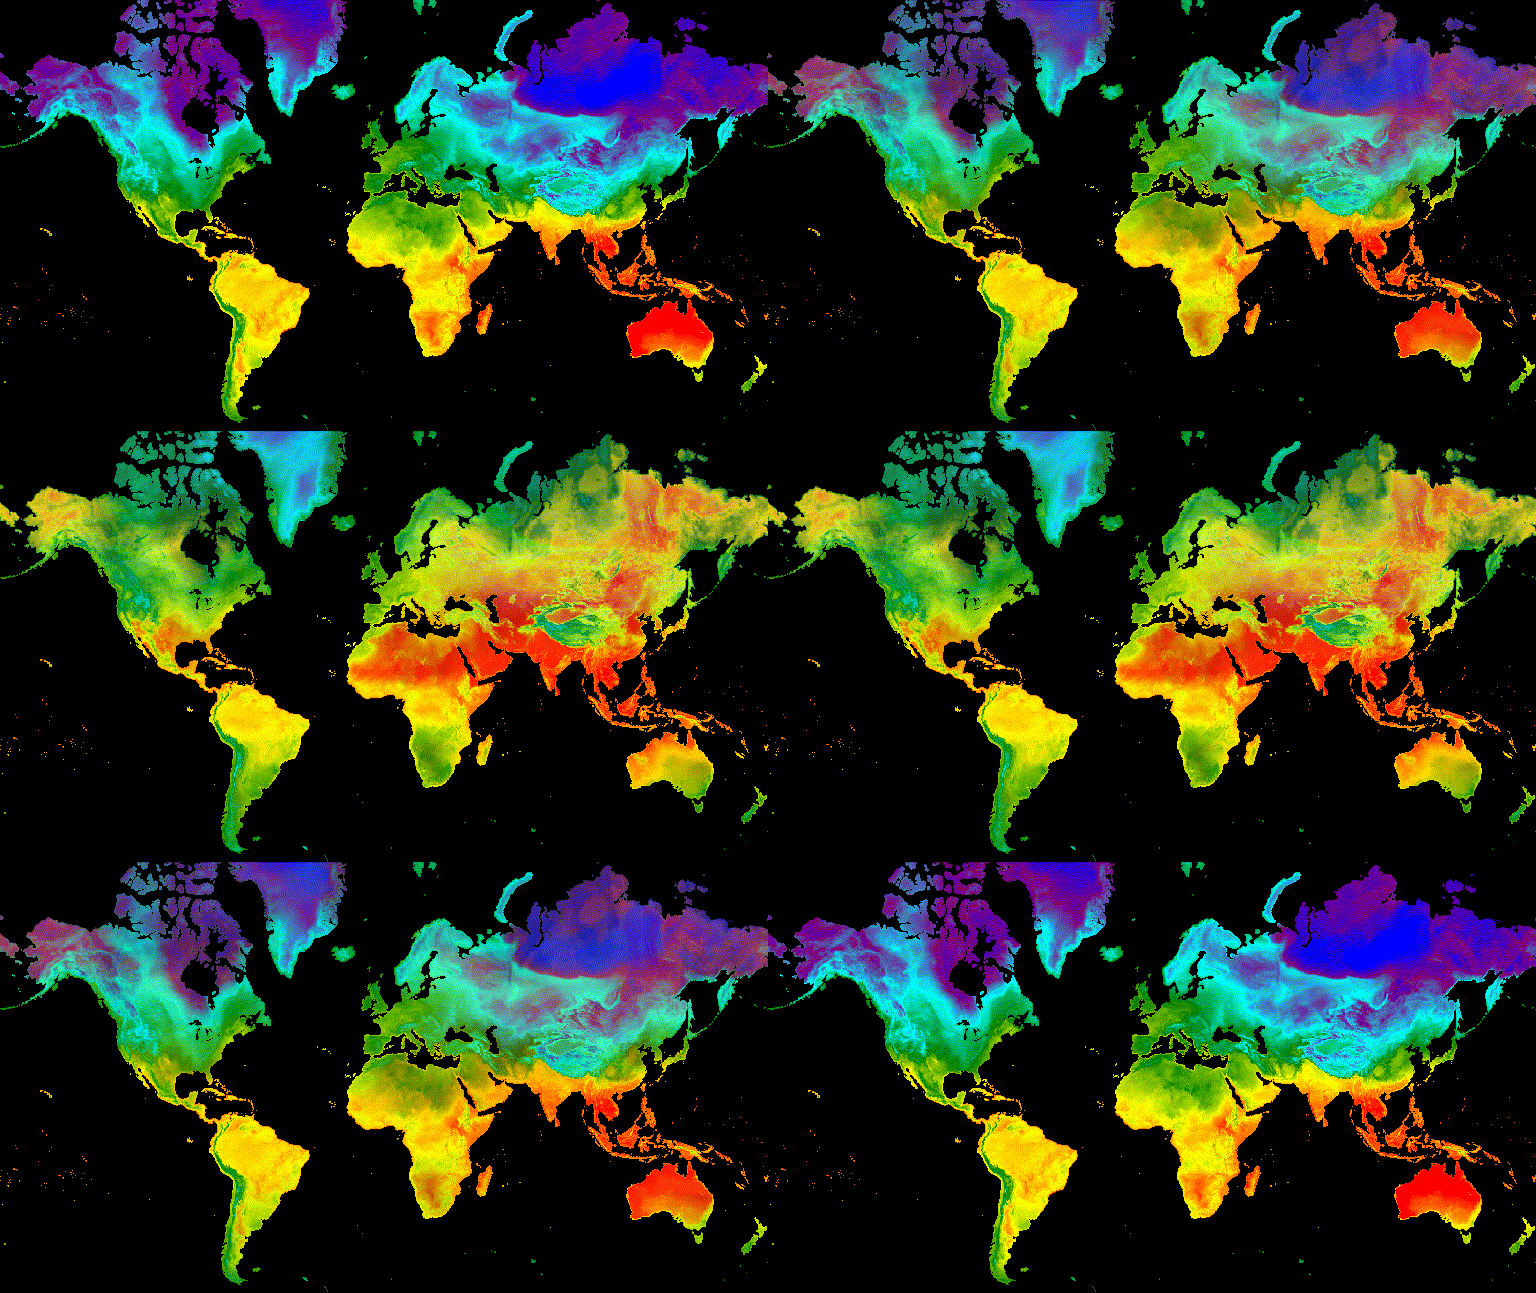
圖 9. 範例:夏至和冬至格林威治標準時間中午 12 點地表溫度的淡出效果。
滑桿
滑桿轉場效果會逐步顯示及隱藏底層圖片。做法是反覆調整覆蓋圖片在各經度範圍的不透明度 (圖 10)。
程式碼編輯器 (JavaScript)
// Define a sequence of longitude increments. Start and end are defined by the
// min and max longitude of the feature to be provided to the region parameter
// of the animation arguments dictionary.
var lonSeq = ee.List.sequence({start: -179, end: 179, count: 20});

// Define a longitude image.
var longitude = ee.Image.pixelLonLat().select('longitude');

// Filter the summer and winter solstice images from the collection and set as
// image objects.
var summerImg = tempColVis.filter(ee.Filter.eq('season', 'summer')).first();
var winterImg = tempColVis.filter(ee.Filter.eq('season', 'winter')).first();

// Map over the list of longitude increments to iteratively adjust the mask
// (opacity) of the overlying image layer. Returns a list of images.
var imgList = lonSeq.map(function(lon) {
  lon = ee.Number(lon);
  var mask = longitude.gt(lon);
  return summerImg.blend(winterImg.updateMask(mask)).set('lon', lon);
});

// Convert the image list to an image collection; concealing phase.
var sliderColForward = ee.ImageCollection.fromImages(imgList);

// Make a copy of the collection that is sorted by descending longitude to
// represent the revealing phase.
var sliderColbackward = sliderColForward
  .sort({property: 'lon', ascending: false});

// Merge the forward and backward phase frame collections.
var sliderCol = sliderColForward.merge(sliderColbackward);

// Define animation arguments.
var videoArgs = {
  dimensions: 768,
  region: aoi,
  framesPerSecond: 25,
  crs: 'EPSG:3857'
};

// Display the animation.
print(ui.Thumbnail(sliderCol, videoArgs));
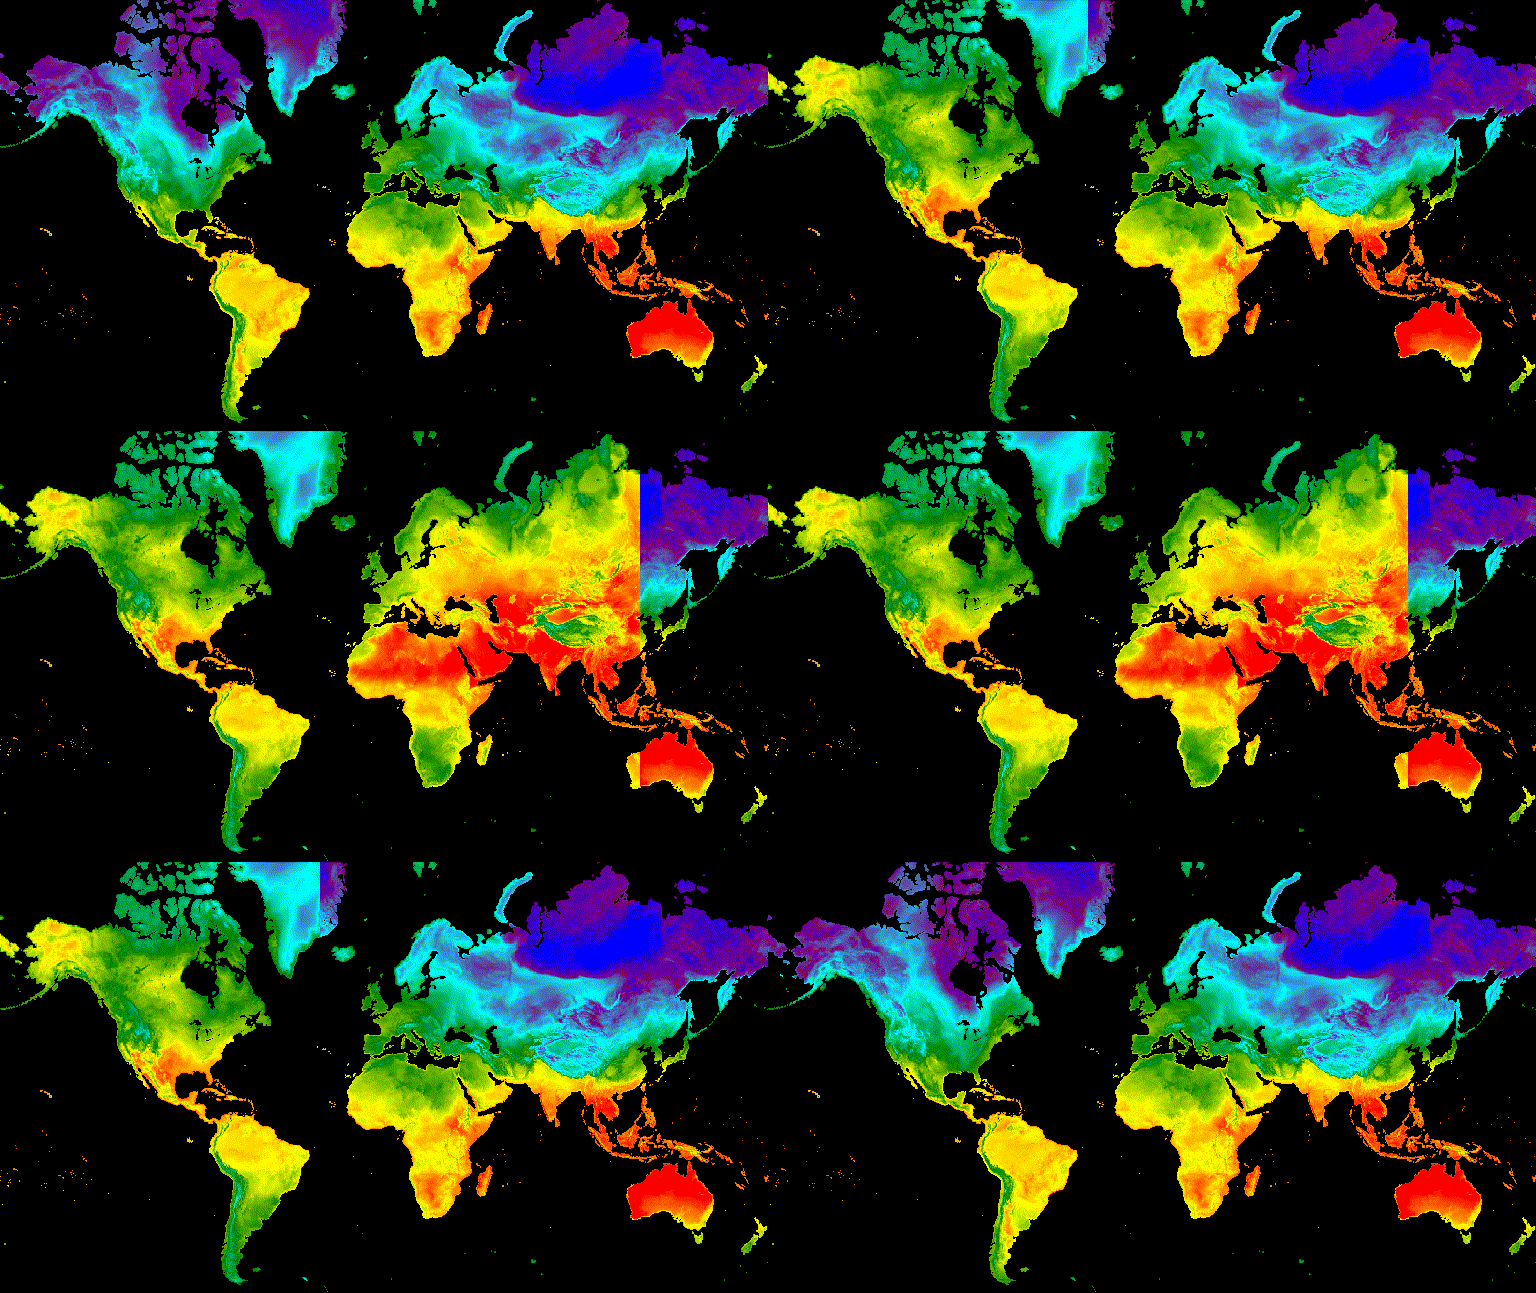
圖 10. 範例:格林威治標準時間中午 12 點,夏至和冬至地表溫度的滑動轉換。