构成 ImageCollection 的图片可以以动画或一系列缩略图(称为“影片片段”)的形式直观呈现。这些方法可让您快速评估 ImageCollection 的内容,并为观察时空变化提供了有效的媒介(图 1)。
getVideoThumbURL()会生成动画图片系列getFilmstripThumbURL()会生成一系列缩略图
以下部分介绍了如何准备 ImageCollection 以进行可视化,为每种集合可视化方法提供了示例代码,并介绍了几种高级动画技术。
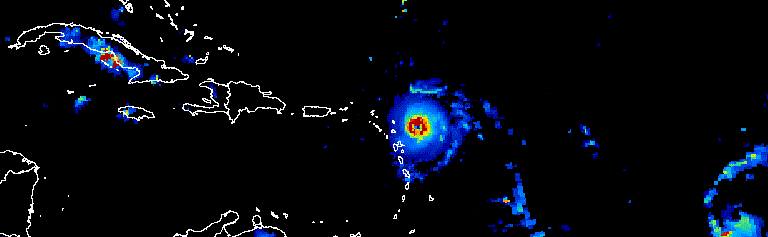
图 1. 动画:显示 2017 年 9 月三天内大西洋飓风的演变过程。
收集准备
过滤、合成、排序和设置照片集内图片的样式,以便仅显示感兴趣的照片或强调某种现象。您可以将任何 ImageCollection 作为可视化函数的输入提供,但考虑到年内和年际日期范围、观测间隔、区域范围、质量和表示方式的精选集合可以取得更好的结果。
过滤
过滤图片集,以便仅包含与可视化图表用途相符的相关数据。考虑日期、空间范围、质量和特定于给定数据集的其他属性。
例如,按以下条件过滤 Sentinel-2 地表反射率数据集:
单个日期范围,
Code Editor (JavaScript)
var s2col = ee.ImageCollection('COPERNICUS/S2_SR')
  .filterDate('2018-01-01', '2019-01-01');
一个序列的日期范围,
Code Editor (JavaScript)
var s2col = ee.ImageCollection('COPERNICUS/S2_SR')
  .filter(ee.Filter.calendarRange(171, 242, 'day_of_year'));
感兴趣的地区
Code Editor (JavaScript)
var s2col = ee.ImageCollection('COPERNICUS/S2_SR')
  .filterBounds(ee.Geometry.Point(-122.1, 37.2));
或图片属性。
Code Editor (JavaScript)
var s2col = ee.ImageCollection('COPERNICUS/S2_SR')
  .filter(ee.Filter.lt('CLOUDY_PIXEL_PERCENTAGE', 50));
链接多个过滤条件。
Code Editor (JavaScript)
var s2col = ee.ImageCollection('COPERNICUS/S2_SR')
  .filterDate('2018-01-01', '2019-01-01')
  .filterBounds(ee.Geometry.Point(-122.1, 37.2))
  .filter('CLOUDY_PIXEL_PERCENTAGE < 50');
合成
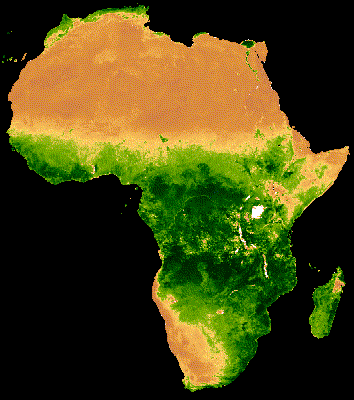
合并年内和年际日期范围,以减少合集中的图片数量并提升质量。例如,假设您要创建一个可视化图表,显示非洲的年 NDVI 数据。一种方法是,只需过滤 MODIS 16 天 NDVI 集合,即可包含 2018 年的所有观测数据。
Code Editor (JavaScript)
var ndviCol = ee.ImageCollection('MODIS/006/MOD13A2')
  .filterDate('2018-01-01', '2019-01-01')
  .select('NDVI');
按过滤条件和求和方式计算的跨年复合数据
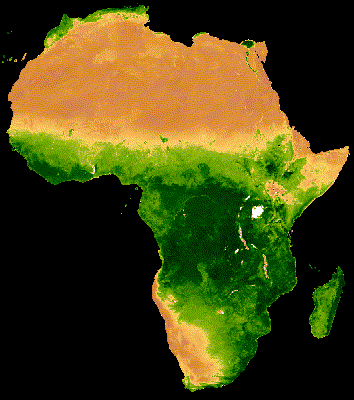
对上述集合的可视化显示,在云层较厚的森林区域存在大量噪点(图 2a)。通过按 MODIS 集合中所有年份的中位数缩减序列日期范围,可以获得更好的表示法。
Code Editor (JavaScript)
// Make a day-of-year sequence from 1 to 365 with a 16-day step.
var doyList = ee.List.sequence(1, 365, 16);

// Import a MODIS NDVI collection.
var ndviCol = ee.ImageCollection('MODIS/006/MOD13A2').select('NDVI');

// Map over the list of days to build a list of image composites.
var ndviCompList = doyList.map(function(startDoy) {
  // Ensure that startDoy is a number.
  startDoy = ee.Number(startDoy);

  // Filter images by date range; starting with the current startDate and
  // ending 15 days later. Reduce the resulting image collection by median.
  return ndviCol
    .filter(ee.Filter.calendarRange(startDoy, startDoy.add(15), 'day_of_year'))
    .reduce(ee.Reducer.median());
});

// Convert the image List to an ImageCollection.
var ndviCompCol = ee.ImageCollection.fromImages(ndviCompList);
此集合生成的动画噪声较少,因为每个图片都代表了 20 多年数据的 16 天 NDVI 复合图像的中位数(图 1b)。如需详细了解此动画,请参阅此教程。
 |
 |
|---|---|
| 图 2a. 不包含年际合成的年度 NDVI。 | 图 2b. 包含年际合成的年度 NDVI。 |
按过滤条件和缩减方式计算的年度内复合
上例应用了跨年合成。它还有助于合成一系列年内观测结果。例如,Landsat 数据每 16 天收集一次,针对每个传感器的给定场景,但图片的某些部分通常会被云层遮挡。遮盖云层并合成同一季节的多张图片,可以生成更少云层的画面。请考虑以下示例,其中 7 月和 8 月的 Landsat 5 图像是使用 1985 年至 2011 年每个年份的中位数合成的。
Code Editor (JavaScript)
// Assemble a collection of Landsat surface reflectance images for a given
// region and day-of-year range.
var lsCol = ee.ImageCollection('LANDSAT/LT05/C02/T1_L2')
  .filterBounds(ee.Geometry.Point(-122.9, 43.6))
  .filter(ee.Filter.dayOfYear(182, 243))
  // Add the observation year as a property to each image.
  .map(function(img) {
    return img.set('year', ee.Image(img).date().get('year'));
  });


// Define a function to scale the data and mask unwanted pixels.
function maskL457sr(image) {
  // Bit 0 - Fill
  // Bit 1 - Dilated Cloud
  // Bit 2 - Unused
  // Bit 3 - Cloud
  // Bit 4 - Cloud Shadow
  var qaMask = image.select('QA_PIXEL').bitwiseAnd(parseInt('11111', 2)).eq(0);
  var saturationMask = image.select('QA_RADSAT').eq(0);

  // Apply the scaling factors to the appropriate bands.
  var opticalBands = image.select('SR_B.').multiply(0.0000275).add(-0.2);
  var thermalBand = image.select('ST_B6').multiply(0.00341802).add(149.0);

  // Replace the original bands with the scaled ones and apply the masks.
  return image.addBands(opticalBands, null, true)
      .addBands(thermalBand, null, true)
      .updateMask(qaMask)
      .updateMask(saturationMask);
}

// Define a list of unique observation years from the image collection.
var years = ee.List(lsCol.aggregate_array('year')).distinct().sort();

// Map over the list of years to build a list of annual image composites.
var lsCompList = years.map(function(year) {
  return lsCol
    // Filter image collection by year.
    .filterMetadata('year', 'equals', year)
    // Apply cloud mask.
    .map(maskL457sr)
    // Reduce image collection by median.
    .reduce(ee.Reducer.median())
    // Set composite year as an image property.
    .set('year', year);
});

// Convert the image List to an ImageCollection.
var lsCompCol = ee.ImageCollection.fromImages(lsCompList);
通过联接和求和计算出年内复合值
请注意,前面两个组合方法会映射 List 天和年,以增量方式定义要过滤和组合的新日期。应用联接是实现此操作的另一种方法。在以下代码段中,定义了一个唯一的年份集合,然后应用了 saveAll 联接来识别与给定年份对应的所有图片。属于给定年份的图片会分组到一个 List 对象中,该对象会存储为各个年份代表的属性,并位于不同的年份集合中。通过在对不同的年份集合映射的函数中求和这些列表中定义的 ImageCollections,从这些列表生成年度复合指数。
Code Editor (JavaScript)
// Assemble a collection of Landsat surface reflectance images for a given
// region and day-of-year range.
var lsCol = ee.ImageCollection('LANDSAT/LT05/C02/T1_L2')
  .filterBounds(ee.Geometry.Point(-122.9, 43.6))
  .filter(ee.Filter.dayOfYear(182, 243))
  // Add the observation year as a property to each image.
  .map(function(img) {
    return img.set('year', ee.Image(img).date().get('year'));
  });

// Make a distinct year collection; one image representative per year.
var distinctYears = lsCol.distinct('year').sort('year');

// Define a join filter; one-to-many join on ‘year’ property.
var filter = ee.Filter.equals({leftField: 'year', rightField: 'year'});

// Define a join.
var join = ee.Join.saveAll('year_match');

// Apply the join; results in 'year_match' property being added to each distinct
// year representative image. The list includes all images in the collection
// belonging to the respective year.
var joinCol = join.apply(distinctYears, lsCol, filter);

// Define a function to scale the data and mask unwanted pixels.
function maskL457sr(image) {
  // Bit 0 - Fill
  // Bit 1 - Dilated Cloud
  // Bit 2 - Unused
  // Bit 3 - Cloud
  // Bit 4 - Cloud Shadow
  var qaMask = image.select('QA_PIXEL').bitwiseAnd(parseInt('11111', 2)).eq(0);
  var saturationMask = image.select('QA_RADSAT').eq(0);

  // Apply the scaling factors to the appropriate bands.
  var opticalBands = image.select('SR_B.').multiply(0.0000275).add(-0.2);
  var thermalBand = image.select('ST_B6').multiply(0.00341802).add(149.0);

  // Replace the original bands with the scaled ones and apply the masks.
  return image.addBands(opticalBands, null, true)
      .addBands(thermalBand, null, true)
      .updateMask(qaMask)
      .updateMask(saturationMask);
}

// Map over the distinct years collection to build a list of annual image
// composites.
var lsCompList = joinCol.map(function(img) {
  // Get the list of images belonging to the given year.
  return ee.ImageCollection.fromImages(img.get('year_match'))
    // Apply cloud mask.
    .map(maskL457sr)
    // Reduce image collection by median.
    .reduce(ee.Reducer.median())
    // Set composite year as an image property.
    .copyProperties(img, ['year']);
});

// Convert the image List to an ImageCollection.
var lsCompCol = ee.ImageCollection(lsCompList);
通过联接和求和实现当天复合汇总
合成的另一种情况是创建空间连续的图片拼接图。假设您的感兴趣区域跨越同一路径中的两个 Landsat 行,并且您的目标是显示 2017 年和 2018 年每个 Landsat 8 轨道对应的这两张图片的拼接图像。在这里,按路径和行过滤集合后,系统会使用联接操作对同一轨道(按获取日期定义)的 Landsat 图片进行拼接。
Code Editor (JavaScript)
var lsCol = ee.ImageCollection('LANDSAT/LC08/C02/T1_L2')
  .filterDate('2017-01-01', '2019-01-01')
  .filter('WRS_PATH == 38 && (WRS_ROW == 28 || WRS_ROW == 29)')
  .map(function(img) {
    var date = img.date().format('yyyy-MM-dd');
    return img.set('date', date);
  });

var distinctDates = lsCol.distinct('date').sort('date');
var filter = ee.Filter.equals({leftField: 'date', rightField: 'date'});
var join = ee.Join.saveAll('date_match');
var joinCol = join.apply(distinctDates, lsCol, filter);

var lsColMos = ee.ImageCollection(joinCol.map(function(col) {
  return ee.ImageCollection.fromImages(col.get('date_match')).mosaic();
}));
排序
您可以按时间对合集进行排序,以确保正确的时间顺序,也可以按您选择的属性进行排序。默认情况下,可视化框架系列会按集合的自然顺序排序。您可以使用 sort 集合方法更改系列图书的排列方式,方法是选择一个 Image 属性以按升序或降序排序。例如,如需按观察时间排序,请使用通用的 system:time_start 属性。
Code Editor (JavaScript)
var s2col = ee.ImageCollection('COPERNICUS/S2_SR')
  .filterBounds(ee.Geometry.Point(-122.1, 37.2))
  .sort('system:time_start');
或者,也许应按云量递增来定义顺序,如 Sentinel-2 图像中的示例所示。
Code Editor (JavaScript)
var s2col = ee.ImageCollection('COPERNICUS/S2_SR')
  .filterBounds(ee.Geometry.Point(-122.1, 37.2))
  .sort('CLOUDY_PIXEL_PERCENTAGE');
顺序还可以由派生属性(例如地区平均 NDVI)定义。在这里,区域 NDVI 会作为属性添加到映射函数中的每个图片中,然后对新属性进行排序。
Code Editor (JavaScript)
// Define an area of interest geometry.
var aoi = ee.Geometry.Point(-122.1, 37.2).buffer(1e4);

// Filter MODIS NDVI image collection by a date range.
var ndviCol = ee.ImageCollection('MODIS/061/MOD13A1')
  .filterDate('2018-01-01', '2019-01-01')
  .select('NDVI')
  // Map over the image collection to calculate regional mean NDVI and add
  // the result to each image as a property.
  .map(function(img) {
    var meanNdvi = img.reduceRegion({
      reducer: ee.Reducer.mean(), geometry: aoi, scale: 500});
    return img.set('meanNdvi', meanNdvi.get('NDVI'));
  })
  // Sort the collection by descending regional mean NDVI.
  .sort('meanNdvi', false);
图片可视化
图片可视化功能会将数字转换为颜色。您可以通过以下三种方式控制在合集可视化方法中如何将图片数据表示为颜色:
- 直接向
getVideoThumbURL和getFilmstripThumbURL提供可视化参数。 - 在应用
getVideoThumbURL和getFilmstripThumbURL之前,将visualize图片方法映射到图片集合。 - 在应用
getVideoThumbURL和getFilmstripThumbURL之前,将sldStyle图片方法映射到图片集合。如需了解详情,请参阅样式层描述符。
本指南中的示例使用了选项 1 和 2,其中通过将多波段图像的三个图像波段映射到红色、绿色和蓝色颜色通道,或沿着颜色 Palette 线性对单个波段的值进行分级,从而实现可视化。可视化参数包括:
| 参数 | 说明 | 类型 |
|---|---|---|
| 乐队 | 要映射到 RGB 的三个波段名称的逗号分隔列表 | list |
| 分钟 | 要映射到 0 的值 | 一个数字或三个数字的列表,每个频段对应一个数字 |
| 最大值 | 要映射到 255 的值 | 一个数字或三个数字的列表,每个频段对应一个数字 |
| gain | 用于将每个像素值乘以的值 | 一个数字或三个数字的列表,每个频段对应一个数字 |
| 偏差 | 要添加到每个 DN 的值 | 一个数字或三个数字的列表,每个频段对应一个数字 |
| gamma | 伽玛校正系数 | 一个数字或三个数字的列表,每个频段对应一个数字 |
| palette | CSS 样式颜色字符串列表(仅限单波段图片) | 以英文逗号分隔的十六进制字符串列表 |
| 不透明度 | 图层的不透明度(0.0 表示完全透明,1.0 表示完全不透明) | 数值 |
使用 bands 参数选择要可视化的波段。提供一个或三个乐队名称的列表。对于多波段图像,系统会默认选择前三个波段。波段名称顺序决定了颜色分配;列出的第一个、第二个和第三个波段分别映射到红色、绿色和蓝色。
在可视化图片时,数据范围缩放是一项重要的考虑因素。默认情况下,介于 0 到 1(包括这两个数值)之间的浮点数据值会缩放到介于 0 到 255(包括这两个数值)之间。任何不在此范围内的值都会被强制设为 0 和 255,具体取决于其是否小于 0 或大于 1。对于整数数据,其类型定义的完整容量会缩放到 0 到 255 之间(例如,有符号的 16 位数据的范围为 -32,768 到 32,767,默认情况下会缩放到 [0, 255])。接受默认设置通常会导致可视化结果中的图像特征之间几乎没有对比度。使用 min 和 max 可提高对比度并突出显示特定数据范围。一般来说,您可以将 min 和 max 设置为表示感兴趣区域内数据的第 2 个百分位和第 98 个百分位的数据值。请参阅以下示例,了解如何为数字地形模型计算这些值。
Code Editor (JavaScript)
// Import SRTM global elevation model.
var demImg = ee.Image('USGS/SRTMGL1_003');

// Define a rectangular area of interest.
var aoi = ee.Geometry.Polygon(
  [[
    [-103.84153083119054, 49.083004219142886],
    [-103.84153083119054, 25.06838270664608],
    [-85.64817145619054, 25.06838270664608],
    [-85.64817145619054, 49.083004219142886]
  ]],
  null, false);

// Calculate the 2nd and 98th percentile elevation values from rescaled (to
// 500m) pixels intersecting the area of interest. A Dictionary is returned.
var percentClip = demImg.reduceRegion({
  reducer: ee.Reducer.percentile([2, 98]),
  geometry: aoi,
  scale: 500,
  maxPixels: 3e7
});

// Print the regional 2nd and 98th percentile elevation values. Get the
// dictionary keys and use them to get the values for each percentile summary.
var keys = percentClip.keys();
print('Set vis min to:', ee.Number(percentClip.get(keys.get(0))).round());
print('Set vis max to:', ee.Number(percentClip.get(keys.get(1))).round());
palette 参数用于定义用于表示 8 位可视化图像的颜色。它仅适用于单波段表示法;使用多波段图片指定它会导致错误。如果数据是单波段数据,或者您想可视化多波段图像中的单个波段,请将 forceRgbOutput 参数设置为 true(如果提供了 palette 参数,则无需执行此操作)。使用 min 和 max 参数定义要在 0 到 255 之间线性缩放的值范围。
下面是一个将可视化函数映射到单波段图像集合的示例。导入 MODIS NDVI 集合,设置 visualization 方法的可视化参数,并将用于将值转换为 RGB 图片表示形式的函数映射到 NDVI 集合。
Code Editor (JavaScript)
// Filter MODIS NDVI image collection by a date range.
var ndviCol = ee.ImageCollection('MODIS/061/MOD13A1')
  .filterDate('2018-01-01', '2019-01-01')
  .select('NDVI');

// Define visualization arguments.
var visArgs = {
  min: 0,
  max: 9000,
  palette: [
    'FFFFFF', 'CE7E45', 'DF923D', 'F1B555', 'FCD163', '99B718', '74A901',
    '66A000', '529400', '3E8601', '207401', '056201', '004C00', '023B01',
    '012E01', '011D01', '011301'
  ]
};

// Define a function to convert an image to an RGB visualization image and copy
// properties from the original image to the RGB image.
var visFun = function(img) {
  return img.visualize(visArgs).copyProperties(img, img.propertyNames());
};

// Map over the image collection to convert each image to an RGB visualization
// using the previously defined visualization function.
var ndviColVis = ndviCol.map(visFun);
下面是一个将可视化函数映射到多波段图像集合的示例:
Code Editor (JavaScript)
// Assemble a collection of Sentinel-2 surface reflectance images for a given
// region and date range.
var s2col = ee.ImageCollection('COPERNICUS/S2_SR')
  .filterBounds(ee.Geometry.Point(-96.9037, 48.0395))
  .filterDate('2019-06-01', '2019-10-01');

// Define visualization arguments.
var visArgs = {bands: ['B11', 'B8', 'B3'], min: 300, max: 3500};

// Define a function to convert an image to an RGB visualization image and copy
// properties from the original image to the RGB image.
var visFun = function(img) {
  return img.visualize(visArgs).copyProperties(img, img.propertyNames());
};

// Map over the image collection to convert each image to an RGB visualization
// using the previously defined visualization function.
var s2colVis = s2col.map(visFun);
在本例中,由于给出了三个波段(用于定义每个 RGB 层的强度),因此未提供任何调色板参数。请注意,这两个示例都使用 min 和 max 参数来控制哪些值会被拉伸到 8 位 RGB 数据的极限。
视频缩略图
getVideoThumbURL() 函数会根据 ImageCollection 中的所有图片生成动画,其中每张图片代表一个帧。制作动画的一般工作流程如下:
- 定义一个
Geometry,其边界决定了动画的区域范围。 - 定义
ImageCollection。 - 考虑使用图片可视化功能:将图片可视化函数映射到集合,或将图片可视化参数添加到动画参数集。
- 定义动画参数并调用
getVideoThumbURL方法。
getVideoThumbURL 的结果是一个网址。将网址输出到控制台,然后点击该网址,以启动 Earth Engine 服务器,在新的浏览器标签页中动态生成动画。或者,您也可以对集合及其对应的动画参数调用 ui.Thumbnail 函数,在 Code Editor 控制台中查看动画。渲染完成后,您可以右键点击动画,然后从其上下文菜单中选择适当的选项来下载动画。
以下示例展示了生成一个动画,用于描绘 24 小时内的全球温度。请注意,此示例包含可视化参数和动画参数,而不是先将可视化函数映射到 ImageCollection。运行此脚本后,Code Editor 控制台中应会显示类似于图 3 的动画。
Code Editor (JavaScript)
// Define an area of interest geometry with a global non-polar extent.
var aoi = ee.Geometry.Polygon(
  [[[-179.0, 78.0], [-179.0, -58.0], [179.0, -58.0], [179.0, 78.0]]], null,
  false);

// Import hourly predicted temperature image collection for northern winter
// solstice. Note that predictions extend for 384 hours; limit the collection
// to the first 24 hours.
var tempCol = ee.ImageCollection('NOAA/GFS0P25')
  .filterDate('2018-12-22', '2018-12-23')
  .limit(24)
  .select('temperature_2m_above_ground');

// Define arguments for animation function parameters.
var videoArgs = {
  dimensions: 768,
  region: aoi,
  framesPerSecond: 7,
  crs: 'EPSG:3857',
  min: -40.0,
  max: 35.0,
  palette: ['blue', 'purple', 'cyan', 'green', 'yellow', 'red']
};

// Print the animation to the console as a ui.Thumbnail using the above defined
// arguments. Note that ui.Thumbnail produces an animation when the first input
// is an ee.ImageCollection instead of an ee.Image.
print(ui.Thumbnail(tempCol, videoArgs));

// Alternatively, print a URL that will produce the animation when accessed.
print(tempCol.getVideoThumbURL(videoArgs));
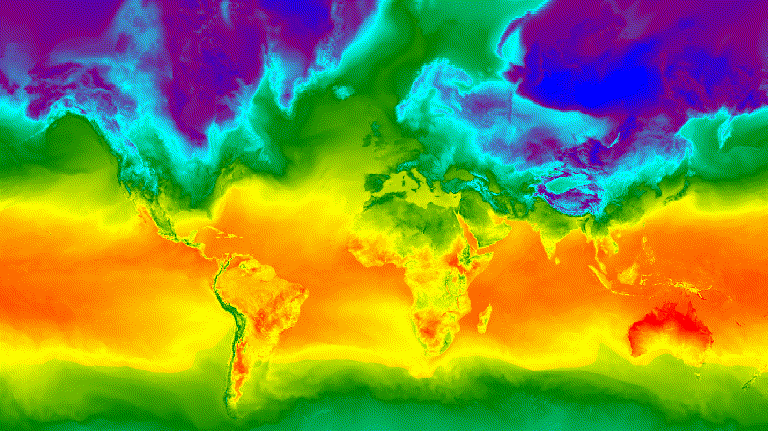
图 3. 北半球冬至的每小时地表温度,以动画 GIF 图片的形式表示。
视频片段
getFilmstripThumbUrl 函数会生成单个静态图片,表示将 ImageCollection 中的所有图片串联成南北系列。幻灯片画面的顺序遵循合集的自然顺序。
getFilmstripThumbUrl 的结果是一个网址。将网址输出到控制台,然后点击该网址,以便在新的浏览器标签页中启动 Earth Engine 服务器,以便动态生成图片。渲染完成后,您可以右键点击图片,然后从其上下文菜单中选择适当的选项来下载图片。
以下代码段使用与上面的视频缩略图示例相同的集合。运行此脚本后,代码编辑器控制台中应会显示类似于图 4 的幻灯影片。
Code Editor (JavaScript)
// Define an area of interest geometry with a global non-polar extent.
var aoi = ee.Geometry.Polygon(
  [[[-179.0, 78.0], [-179.0, -58.0], [179.0, -58.0], [179.0, 78.0]]], null,
  false);

// Import hourly predicted temperature image collection for northern winter
// solstice. Note that predictions extend for 384 hours; limit the collection
// to the first 24 hours.
var tempCol = ee.ImageCollection('NOAA/GFS0P25')
  .filterDate('2018-12-22', '2018-12-23')
  .limit(24)
  .select('temperature_2m_above_ground');

// Define arguments for the getFilmstripThumbURL function parameters.
var filmArgs = {
  dimensions: 128,
  region: aoi,
  crs: 'EPSG:3857',
  min: -40.0,
  max: 35.0,
  palette: ['blue', 'purple', 'cyan', 'green', 'yellow', 'red']
};

// Print a URL that will produce the filmstrip when accessed.
print(tempCol.getFilmstripThumbURL(filmArgs));
![]()
图 4. 北半球冬至的每小时地表温度,以影片片段 PNG 图片的形式表示。请注意,幻灯片已分为四个部分进行显示;getFilmstripThumbURL 的结果是一组由南北方向连接的集合图像。
高级技术
以下部分介绍了如何使用剪裁、不透明度和图层合成来通过添加多边形边界、突出显示感兴趣的区域以及比较集合中的图片来增强可视化效果。
请注意,本部分中的以下所有示例都使用了此处定义的相同基本 ImageCollection:
Code Editor (JavaScript)
// Import hourly predicted temperature image collection for northern winter
// solstice. Note that predictions extend for 384 hours; limit the collection
// to the first 24 hours.
var tempCol = ee.ImageCollection('NOAA/GFS0P25')
  .filterDate('2018-12-22', '2018-12-23')
  .limit(24)
  .select('temperature_2m_above_ground');

// Define visualization arguments to control the stretch and color gradient
// of the data.
var visArgs = {
  min: -40.0,
  max: 35.0,
  palette: ['blue', 'purple', 'cyan', 'green', 'yellow', 'red']
};

// Convert each image to an RGB visualization image by mapping the visualize
// function over the image collection using the arguments defined previously.
var tempColVis = tempCol.map(function(img) {
  return img.visualize(visArgs);
});

// Import country features and filter to South American countries.
var southAmCol = ee.FeatureCollection('USDOS/LSIB_SIMPLE/2017')
  .filterMetadata('wld_rgn', 'equals', 'South America');

// Define animation region (South America with buffer).
var southAmAoi = ee.Geometry.Rectangle({
  coords: [-103.6, -58.8, -18.4, 17.4], geodesic: false});
叠加层
您可以使用 blend Image 方法叠加多个图片,其中两个图片中重叠的像素会根据其遮罩(不透明度)进行混合。
矢量叠加层
向图片添加行政区边界多边形和其他几何图形可以提供有价值的空间背景信息。请参考上面的全球每日地表温度动画(图 3)。陆地和海洋之间的边界略有可辨,但可以通过添加国家/地区的多边形叠加层来明确显示。
通过应用 paint 方法,将矢量数据 (Features) 绘制到图片。您可以将特征绘制到现有图片,但更好的做法是将特征绘制到空白图片,为其设置样式,然后将结果与其他设置了样式的图片层混合。独立处理可视化堆栈的每一层有助于更好地控制样式。
以下示例演示了如何将南美洲国家边界绘制到空白 Image,并将结果与全球每日温度集合的每个 Image 进行混合(图 5)。叠加的国家边界可区分陆地和水域,并为温度模式提供背景信息。
Code Editor (JavaScript)
// Define an empty image to paint features to.
var empty = ee.Image().byte();

// Paint country feature edges to the empty image.
var southAmOutline = empty
  .paint({featureCollection: southAmCol, color: 1, width: 1})
  // Convert to an RGB visualization image; set line color to black.
  .visualize({palette: '000000'});

// Map a blend operation over the temperature collection to overlay the country
// border outline image on all collection images.
var tempColOutline = tempColVis.map(function(img) {
  return img.blend(southAmOutline);
});

// Define animation arguments.
var videoArgs = {
  dimensions: 768,
  region: southAmAoi,
  framesPerSecond: 7,
  crs: 'EPSG:3857'
};

// Display the animation.
print(ui.Thumbnail(tempColOutline, videoArgs));
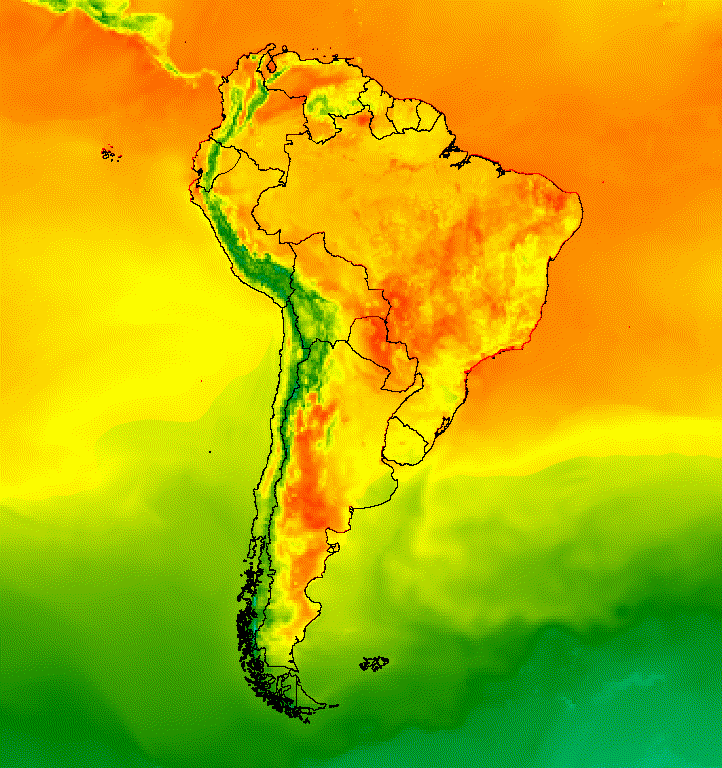
图 5. 向合集中的图片添加矢量叠加层,以提供空间背景信息。
图片叠层
您可以叠加多张图片以实现所需的样式。假设您想强调感兴趣的区域。您可以创建图片可视化图表的柔化副本作为底层,然后叠加原始可视化图表的剪裁版本。基于上一个示例,以下脚本会生成图 6。
Code Editor (JavaScript)
// Define an empty image to paint features to.
var empty = ee.Image().byte();

// Paint country feature edges to the empty image.
var southAmOutline = empty
  .paint({featureCollection: southAmCol, color: 1, width: 1})
  // Convert to an RGB visualization image; set line color to black.
  .visualize({palette: '000000'});

// Map a blend operation over the temperature collection to overlay the country
// border outline image on all collection images.
var tempColOutline = tempColVis.map(function(img) {
  return img.blend(southAmOutline);
});

// Define a partially opaque grey RGB image to dull the underlying image when
// blended as an overlay.
var dullLayer = ee.Image.constant(175).visualize({
  opacity: 0.6, min: 0, max: 255, forceRgbOutput: true});

// Map a two-part blending operation over the country outline temperature
// collection for final styling.
var finalVisCol = tempColOutline.map(function(img) {
  return img
    // Blend the dulling layer with the given country outline temperature image.
    .blend(dullLayer)
    // Blend a clipped copy of the country outline temperature image with the
    // dulled background image.
    .blend(img.clipToCollection(southAmCol));
});

// Define animation arguments.
var videoArgs = {
  dimensions: 768,
  region: southAmAoi,
  framesPerSecond: 7,
  crs: 'EPSG:3857'
};

// Display the animation.
print(ui.Thumbnail(finalVisCol, videoArgs));
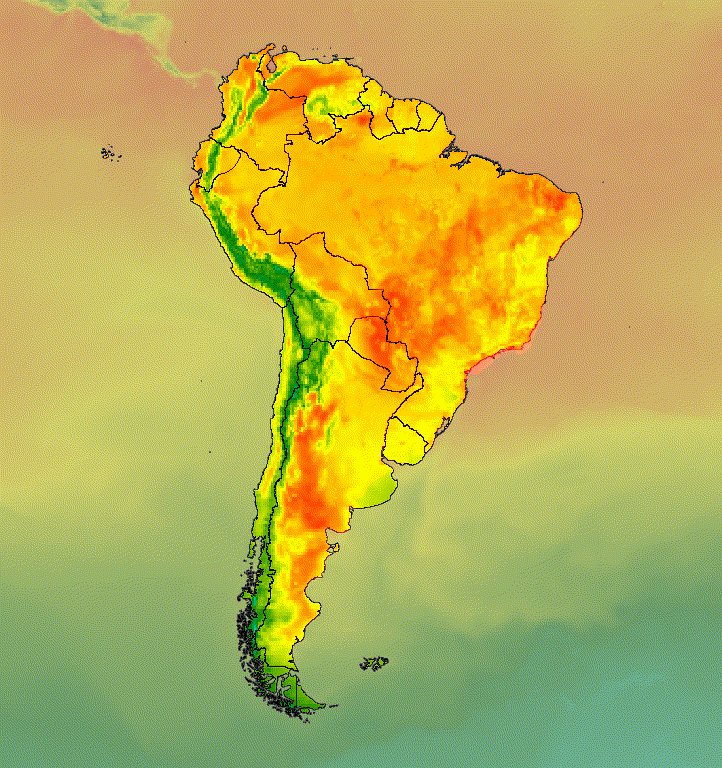
图 6. 剪裁图片并将其叠加在经过调色的副本上,以突出显示感兴趣的区域。
您还可以将图片数据与山体阴影底图层混合,以指示地形并为可视化图表增添深度(图 7)。
Code Editor (JavaScript)
// Define a hillshade layer from SRTM digital elevation model.
var hillshade = ee.Terrain.hillshade(ee.Image('USGS/SRTMGL1_003')
  // Exaggerate the elevation to increase contrast in hillshade.
  .multiply(100))
  // Clip the DEM by South American boundary to clean boundary between
  // land and ocean.
  .clipToCollection(southAmCol);

// Map a blend operation over the temperature collection to overlay a partially
// opaque temperature layer on the hillshade layer.
var finalVisCol = tempColVis.map(function(img) {
  return hillshade
    .blend(img.clipToCollection(southAmCol).visualize({opacity: 0.6}));
});

// Define animation arguments.
var videoArgs = {
  dimensions: 768,
  region: southAmAoi,
  framesPerSecond: 7,
  crs: 'EPSG:3857'
};

// Display the animation.
print(ui.Thumbnail(finalVisCol, videoArgs));
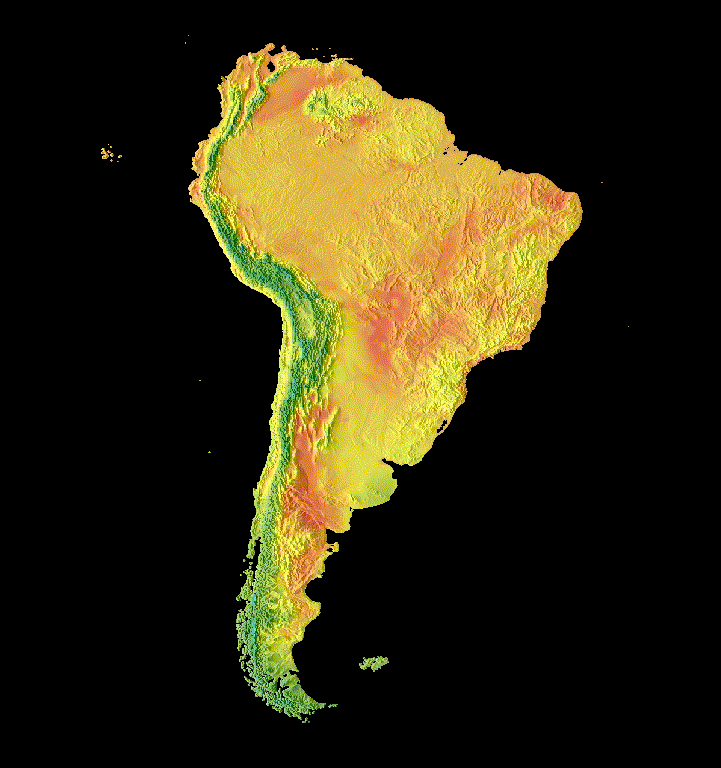
图 7. 通过在山体阴影图层上叠加部分透明的图片数据来显示地形。
转场效果
自定义图片集,使用淡出、闪烁和滑动转场效果制作动画,以显示集合中两张图片之间的差异。以下每个示例都使用由以下脚本生成的相同基本可视化结果:
Code Editor (JavaScript)
// Define an area of interest geometry with a global non-polar extent.
var aoi = ee.Geometry.Polygon(
  [[[-179.0, 78.0], [-179.0, -58.0], [179.0, -58.0], [179.0, 78.0]]], null,
  false);

// Import hourly predicted temperature image collection.
var temp = ee.ImageCollection('NOAA/GFS0P25')

// Define a northern summer solstice temperature image.
var summerSolTemp = temp
  .filterDate('2018-06-21', '2018-06-22')
  .filterMetadata('forecast_hours', 'equals', 12)
  .first()
  .select('temperature_2m_above_ground');

// Define a northern winter solstice temperature image.
var winterSolTemp = temp
  .filterDate('2018-12-22', '2018-12-23')
  .filterMetadata('forecast_hours', 'equals', 12)
  .first()
  .select('temperature_2m_above_ground');

// Combine the solstice images into a collection.
var tempCol = ee.ImageCollection([
  summerSolTemp.set('season', 'summer'),
  winterSolTemp.set('season', 'winter')
]);

// Import international boundaries feature collection.
var countries = ee.FeatureCollection('USDOS/LSIB_SIMPLE/2017');

// Define visualization arguments.
var visArgs = {
  min: -40.0,
  max: 35.0,
  palette: ['blue', 'purple', 'cyan', 'green', 'yellow', 'red']
};

// Convert the image data to RGB visualization images.
// The clip and unmask combination sets ocean pixels to black.
var tempColVis = tempCol.map(function(img) {
  return img
    .visualize(visArgs)
    .clipToCollection(countries)
    .unmask(0)
    .copyProperties(img, img.propertyNames());
});
Flicker
如果合集中只有两张图片(如本例所示),则在合集动画播放时,默认显示效果为闪烁。调整 framesPerSecond 动画参数可加快或减慢闪烁速率。将以下可视化参数应用于上述集合会生成图 8。
Code Editor (JavaScript)
// Define arguments for animation function parameters.
var videoArgs = {
  dimensions: 768,
  region: aoi,
  framesPerSecond: 2,
  crs: 'EPSG:3857'
};

// Display animation to the Code Editor console.
print(ui.Thumbnail(tempColVis, videoArgs));
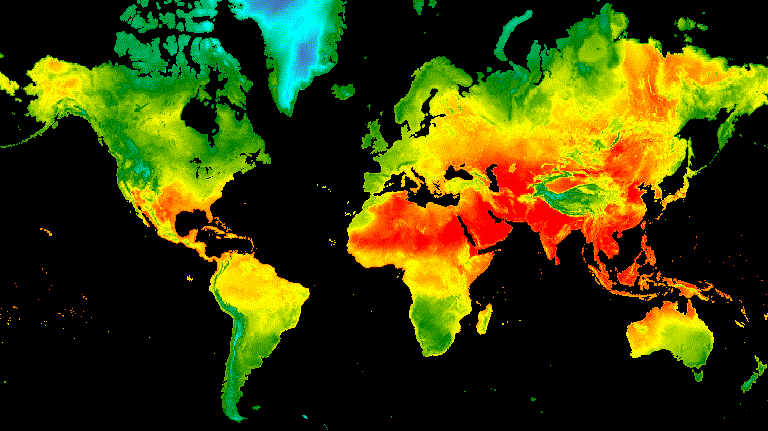
图 8. 格林尼治标准时间正午北半球和冬至日的表面温度闪烁示例。
淡化
通过同时降低一个图层的不透明度,同时在一系列不透明度增量(从接近 0 到 1)中增加另一个图层的不透明度,即可实现两个图层之间的淡出过渡效果(图 9)。
Code Editor (JavaScript)
// Define a sequence of decreasing opacity increments. Note that opacity cannot
// be 0, so near 1 and 0 are used. Near 1 is needed because a compliment is
// calculated in a following step that can result in 0 if 1 is an element of the
// list.
var opacityList = ee.List.sequence({start: 0.99999, end: 0.00001, count: 20});

// Filter the summer and winter solstice images from the collection and set as
// image objects.
var summerImg = tempColVis.filter(ee.Filter.eq('season', 'summer')).first();
var winterImg = tempColVis.filter(ee.Filter.eq('season', 'winter')).first();

// Map over the list of opacity increments to iteratively adjust the opacity of
// the two solstice images. Returns a list of images.
var imgList = opacityList.map(function(opacity) {
  var opacityCompliment = ee.Number(1).subtract(ee.Number(opacity));
  var winterImgFade = winterImg.visualize({opacity: opacity});
  var summerImgFade = summerImg.visualize({opacity: opacityCompliment});
  return summerImgFade.blend(winterImgFade).set('opacity', opacity);
});

// Convert the image list to an image collection; the forward phase.
var fadeForward = ee.ImageCollection.fromImages(imgList);

// Make a copy of the collection that is sorted by ascending opacity to
// represent the reverse phase.
var fadeBackward = fadeForward.sort({property: 'opacity'});

// Merge the forward and reverse phase frame collections.
var fadeCol = fadeForward.merge(fadeBackward);

// Define animation arguments.
var videoArgs = {
  dimensions: 768,
  region: aoi,
  framesPerSecond: 25,
  crs: 'EPSG:3857'
};

// Display the animation.
print(ui.Thumbnail(fadeCol, videoArgs));

图 9. 夏至和冬至时格林尼治标准时间正午的表面温度之间逐渐减弱的示例。
滑块
滑块过渡会逐渐显示和隐藏底层图片层。这是通过在一系列经度范围内迭代调整叠加图片的不透明度来实现的(图 10)。
Code Editor (JavaScript)
// Define a sequence of longitude increments. Start and end are defined by the
// min and max longitude of the feature to be provided to the region parameter
// of the animation arguments dictionary.
var lonSeq = ee.List.sequence({start: -179, end: 179, count: 20});

// Define a longitude image.
var longitude = ee.Image.pixelLonLat().select('longitude');

// Filter the summer and winter solstice images from the collection and set as
// image objects.
var summerImg = tempColVis.filter(ee.Filter.eq('season', 'summer')).first();
var winterImg = tempColVis.filter(ee.Filter.eq('season', 'winter')).first();

// Map over the list of longitude increments to iteratively adjust the mask
// (opacity) of the overlying image layer. Returns a list of images.
var imgList = lonSeq.map(function(lon) {
  lon = ee.Number(lon);
  var mask = longitude.gt(lon);
  return summerImg.blend(winterImg.updateMask(mask)).set('lon', lon);
});

// Convert the image list to an image collection; concealing phase.
var sliderColForward = ee.ImageCollection.fromImages(imgList);

// Make a copy of the collection that is sorted by descending longitude to
// represent the revealing phase.
var sliderColbackward = sliderColForward
  .sort({property: 'lon', ascending: false});

// Merge the forward and backward phase frame collections.
var sliderCol = sliderColForward.merge(sliderColbackward);

// Define animation arguments.
var videoArgs = {
  dimensions: 768,
  region: aoi,
  framesPerSecond: 25,
  crs: 'EPSG:3857'
};

// Display the animation.
print(ui.Thumbnail(sliderCol, videoArgs));
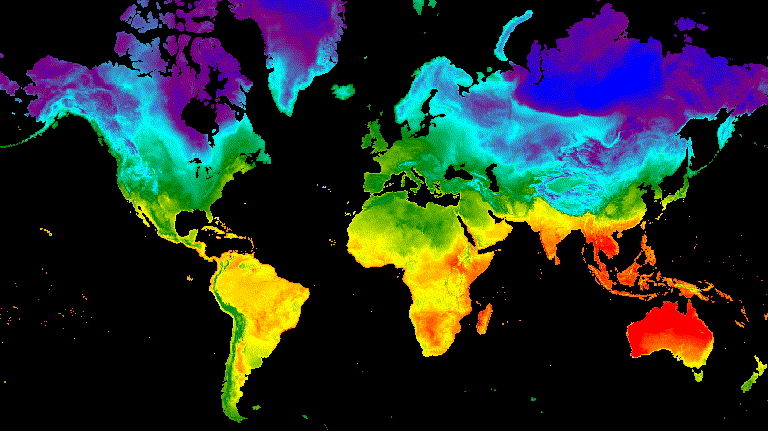
图 10. 夏至和冬至时格林威治标准时间 12 点的表面温度之间的滑动过渡示例。