计算年度森林损失
在上一部分中,您学习了如何使用 reduceRegion 方法计算指定感兴趣区域内损失的森林总面积。与其计算总损失,不如计算每年的损失。在 Earth Engine 中,可以使用分组缩减器来实现此目的。
如需对 reduceRegion() 的输出进行分组,您可以指定一个分组频段,该频段按整数像素值定义组。在以下示例中,我们稍微修改了之前的代码,并向原始图片添加了 lossYear 波段。lossYear 波段中的每个像素都包含 0 到 14 之间的值,用于指示发生损失的年份。我们还将 reducer 更改为分组 reducer,并指定分组波段的波段指数 (1),以便根据 lossYear 波段中的值对像素面积进行求和和分组。
代码编辑器 (JavaScript)
// Load country boundaries from LSIB.
var countries = ee.FeatureCollection('USDOS/LSIB_SIMPLE/2017');
// Get a feature collection with just the Congo feature.
var congo = countries.filter(ee.Filter.eq('country_co', 'CF'));

// Get the loss image.
// This dataset is updated yearly, so we get the latest version.
var gfc2017 = ee.Image('UMD/hansen/global_forest_change_2017_v1_5');
var lossImage = gfc2017.select(['loss']);
var lossAreaImage = lossImage.multiply(ee.Image.pixelArea());

var lossYear = gfc2017.select(['lossyear']);
var lossByYear = lossAreaImage.addBands(lossYear).reduceRegion({
  reducer: ee.Reducer.sum().group({
    groupField: 1
    }),
  geometry: congo,
  scale: 30,
  maxPixels: 1e9
});
print(lossByYear);
运行上述代码后,您会看到以嵌套列表形式输出的每年森林损失面积,该列表名为 groups。我们可以稍微调整一下输出格式,使结果成为一个字典,其中年份为键,损失面积为值。请注意,我们使用 format() 方法将年份值从 0-14 转换为 2000-2014。
代码编辑器 (JavaScript)
var statsFormatted = ee.List(lossByYear.get('groups'))
  .map(function(el) {
    var d = ee.Dictionary(el);
    return [ee.Number(d.get('group')).format("20%02d"), d.get('sum')];
  });
var statsDictionary = ee.Dictionary(statsFormatted.flatten());
print(statsDictionary);
制作图表
现在,我们已经有了年度损失数据,可以准备图表了。我们将使用 ui.Chart.array.values() 方法。此方法接受一个输入值数组(或列表)和一个 X 轴标签数组(或列表)。
代码编辑器 (JavaScript)
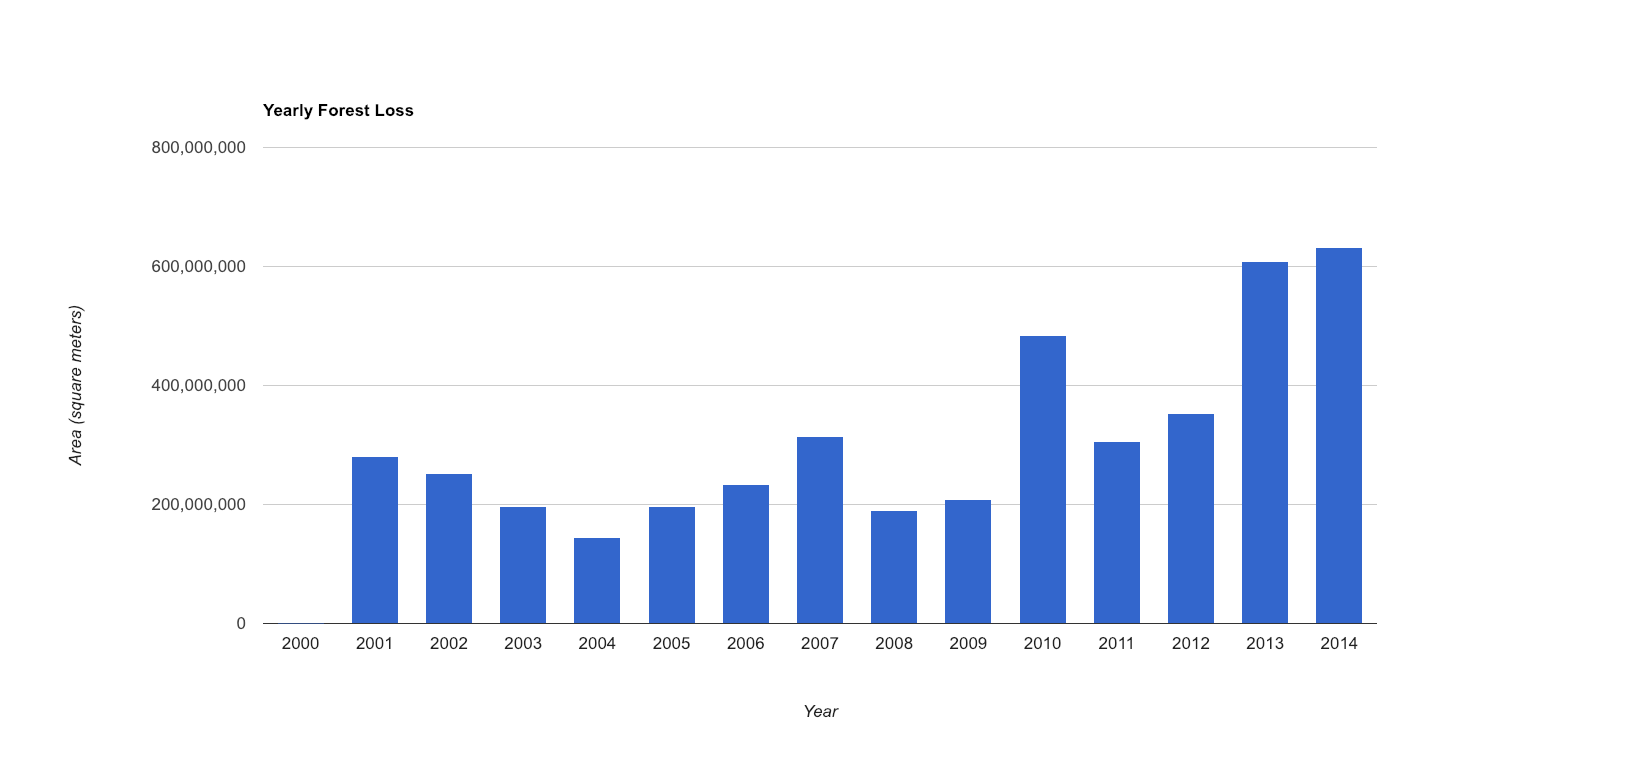
var chart = ui.Chart.array.values({
  array: statsDictionary.values(),
  axis: 0,
  xLabels: statsDictionary.keys()
}).setChartType('ColumnChart')
  .setOptions({
    title: 'Yearly Forest Loss',
    hAxis: {title: 'Year', format: '####'},
    vAxis: {title: 'Area (square meters)'},
    legend: { position: "none" },
    lineWidth: 1,
    pointSize: 3
  });
print(chart);
结果应如下图所示。