Earth Engine 是一款强大的分析工具,但您可能需要导出分析结果,以便将图表、图片、地图等嵌入到报告或出版物中。在本部分中,您将学习如何创建可导出并在其他软件中查看的图表和图片。请注意,在上一部分中,您使用了如下代码将 NDVI 波段添加到集合中的每张图片,其中 l8 变量引用了 Landsat 8 TOA 反射率集合:
代码编辑器 (JavaScript)
// Import the Landsat 8 TOA image collection.
var l8 = ee.ImageCollection('LANDSAT/LC08/C02/T1_TOA');

// Map a function over the Landsat 8 TOA collection to add an NDVI band.
var withNDVI = l8.map(function(image) {
  var ndvi = image.normalizedDifference(['B5', 'B4']).rename('NDVI');
  return image.addBands(ndvi);
});
正在绘制图表
假设您实际需要的是特定位置随时间变化的 NDVI 图表。如需制作此类图表,第一步是选择感兴趣的位置。通过获取点绘制工具 ( ) 创建点,并在感兴趣的区域中绘制单个点几何图形。(如果您已有导入项,请先将鼠标悬停在几何图形导入上,然后点击 + 新图层)。
将点定位在农业区、落叶林、一年生草地或具有年度周期的其他地表覆盖区域。将导入命名为
) 创建点,并在感兴趣的区域中绘制单个点几何图形。(如果您已有导入项,请先将鼠标悬停在几何图形导入上,然后点击 + 新图层)。
将点定位在农业区、落叶林、一年生草地或具有年度周期的其他地表覆盖区域。将导入命名为 roi。(如需了解如何以编程方式创建几何图形,请参阅此页面)。
现在,我们使用 roi 点来制作该点下方像素的 NDVI 随时间变化的图表。在 Earth Engine 中制作图表的方法是使用 ui.Chart 软件包。(详细了解如何在 Earth Engine 中制作图表)。
具体而言,如需制作随时间变化的图表,您可以使用 ui.Chart.image.series() 方法:
代码编辑器 (JavaScript)
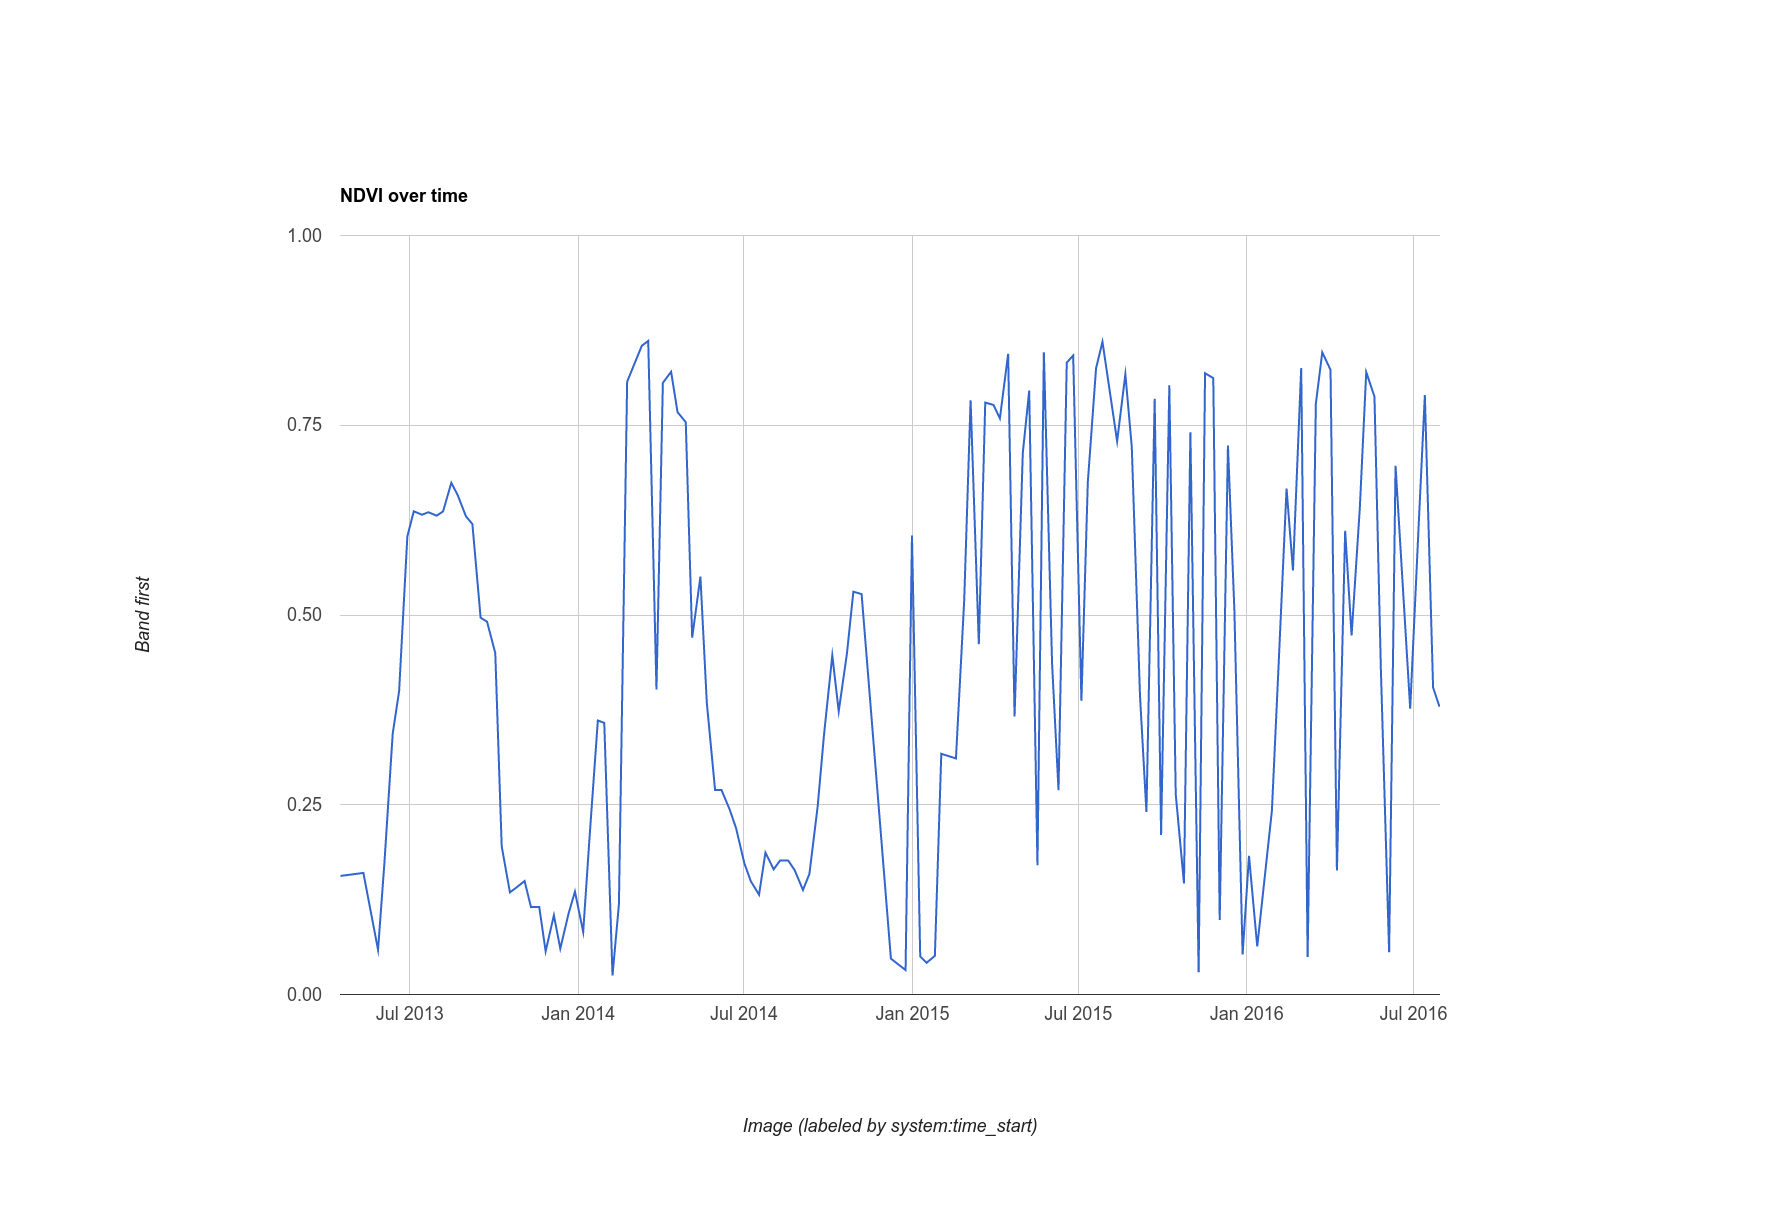
// Create a chart.
var chart = ui.Chart.image.series({
  imageCollection: withNDVI.select('NDVI'),
  region: roi,
  reducer: ee.Reducer.first(),
  scale: 30
}).setOptions({title: 'NDVI over time'});

// Display the chart in the console.
print(chart);
对于 roi 几何图形,我们选择了一个农业区域中的点,从而生成了如图 10 所示的图表。请注意,图表构造函数的参数包括缩减器和比例,例如 reduceRegion()。由于我们提供的点作为区域只能与一个像素相交,因此使用“first”归约器就足够了。如果您有较大的区域,则应使用“平均值”或其他指定如何聚合像素的缩减器。另请注意,如需直观呈现图表,您只需将其打印出来即可。
题外话:Landsat 的简单云遮挡处理
您可能已经注意到,此图表中该点的 NDVI 值时序看起来有点杂乱。这很可能是因为云。为了缓解这种效应,Earth Engine 针对具有热红外波段的 Landsat 传感器提供了一种云掩码算法:ee.Algorithms.Landsat.simpleCloudScore()。它以 Landsat TOA 反射率影像作为输入,并添加一个名为 cloud 的波段,该波段是像素中云量的指数,范围从 0 到 100,分别表示从最少到最多云量。通过修改您在集合中映射的函数,您可以在云指数中使用任意阈值 (20) 来稍微清理一下图表:
代码编辑器 (JavaScript)
var cloudlessNDVI = l8.map(function(image) {
  // Get a cloud score in [0, 100].
  var cloud = ee.Algorithms.Landsat.simpleCloudScore(image).select('cloud');

  // Create a mask of cloudy pixels from an arbitrary threshold.
  var mask = cloud.lte(20);

  // Compute NDVI.
  var ndvi = image.normalizedDifference(['B5', 'B4']).rename('NDVI');

  // Return the masked image with an NDVI band.
  return image.addBands(ndvi).updateMask(mask);
});

print(ui.Chart.image.series({
  imageCollection: cloudlessNDVI.select('NDVI'),
  region: roi,
  reducer: ee.Reducer.first(),
  scale: 30
}).setOptions({title: 'Cloud-masked NDVI over time'}));
云掩盖后的结果如图 11 所示。请注意,时间序列看起来更平滑,但可能仍包含受云影响的像素。调整云端指数的阈值,并观察图表中的时间序列,了解此阈值会如何影响结果。

导出图片
您已经了解如何导出 Earth Engine 计算的数据图表,但如何导出整个影像呢?例如,假设您已构建最绿像素合成图(如上一部分中所述):
代码编辑器 (JavaScript)
var greenest = cloudlessNDVI.qualityMosaic('NDVI');
此代码与您之前所做操作的唯一区别在于,现在我们使用的是云端屏蔽的集合。您可以使用 Export 软件包导出此数据集的子集(由区域定义)。(详细了解如何从 Earth Engine 导出栅格和矢量数据。)例如,如需导出可轻松嵌入其他文档中的图片,我们来创建一张可视化图片(如您之前所做的那样),然后将其导出到您的 Google 云端硬盘文件夹:
代码编辑器 (JavaScript)
// Create a 3-band, 8-bit, color-IR composite to export.
var visualization = greenest.visualize({
  bands: ['B5', 'B4', 'B3'],
  max: 0.4
});

// Create a task that you can launch from the Tasks tab.
Export.image.toDrive({
  image: visualization,
  description: 'Greenest_pixel_composite',
  scale: 30
});
运行此代码时,请注意,系统会在 Tasks 标签页中创建一个新任务。 如需启动导出配置对话框,请点击任务标签页中的运行按钮。配置完任务后,点击对话框中的运行按钮开始导出。但在此之前,请注意:
在不使用 region 实参的情况下导出时,您应谨慎行事,原因在于:如果您为 scale 设置的值相对较小,并且地图缩小到较大区域,那么您可能会将非常大的图片导出到云端硬盘文件夹。如需了解详情和查看可能的配置参数列表,请参阅文档标签页中的 Export.image.toDrive() 文档。
Earth Engine API 简介到此结束!现在,您已经了解了许多最常用的 Earth Engine 功能,应该能够自信地进行更复杂的分析。请务必阅读文档并在论坛中搜索其他问题的答案。祝大家编码顺利!