本页介绍了如何创建图表,以便使用 Cloud Monitoring 监控 Earth Engine 计算和存储用量。
您还可以通过其他方式从 Cloud 控制台监控 Earth Engine 使用情况,本文档将不重点介绍这些方式,但包括:
- API 和服务 > 指标 页面,其中显示了基本指标,包括流量(请求数)、错误和延迟时间(按 API 方法、响应代码或凭据)。
- API 和服务 > 配额和系统限制 页面,其中显示了存储的素材资源的字节数以及素材资源的读取请求数。
- API 和服务 > 凭据 页面,其中会显示已用于访问该 API 的凭据(例如服务账号)。
在 Cloud Monitoring 中查看消耗情况
在 Metrics Explorer 中绘制指标图表
在 Cloud 控制台中,依次前往 Monitoring > Metrics Explorer 页面。
选择您的项目名称(如果尚未在页面顶部选择该名称)。
- 注意:您必须拥有适当的 Identity and Access Management (IAM) 权限才能访问监控数据。
点击选择指标,选择要添加到图表中的指标。
- Earth Engine 指标位于 Earth Engine Cloud 项目资源下。
- 默认情况下,系统仅会显示过去一小时内处于活跃状态的资源和指标。调整时间范围或取消选中“活跃”过滤条件,即可查看更多指标。
选择指标后,点击应用。
在顶部窗格中,配置下拉菜单过滤条件,以设置数据的可视化方式。
Cloud Monitoring 文档提供了有关使用 Cloud Monitoring 的更多指南。具体而言,选择要绘制图表的指标页面详细介绍了构建查询的不同方法,过滤和汇总页面则详细介绍了如何配置时间序列。
可用指标
| 指标 | 说明 | 可用标签 |
|---|---|---|
| 已完成的 EECU(秒) | 成功请求的 Earth Engine 计算用量(以 EECU 秒为单位)。系统会在请求完成时报告用量,但不会针对失败的请求报告用量。 |
compute_type:计算类型,基于请求的
处理环境。[online、batch、highvolume] 之一。
client_type:客户端类型(如果已知),例如:ee-js/latest 或 python/v0.1.300。未为批量计算设置客户端类型。
workload_tag:工作负载标记(如果在客户端中提供),例如:my-export1。如需了解如何设置此标签,请参阅 工作负载标记 部分。
|
| 正在进行的 EECU(秒) | 所有请求的 Earth Engine 计算用量(以 EECU 秒为单位)。在请求运行期间,系统会定期报告使用情况。 |
compute_type:计算类型,基于请求的
处理环境。[online、batch、highvolume] 之一。
client_type:客户端类型(如果已知),例如:ee-js/latest 或 python/v0.1.300。未为批量计算设置客户端类型。
workload_tag:工作负载标记(如果在客户端中提供),例如:my-export1。如需了解如何设置此标签,请参阅 工作负载标记 部分。
|
| 已用字节数 | 使用的 Earth Engine 资产存储空间字节数。每 30 分钟采样一次。 | 不适用 |
如需查看 Cloud Monitoring 中可用指标的完整列表,请参阅 Google Cloud 指标。
单位和校准器
默认情况下,计算指标将显示为在 Min interval(默认 1 分钟)内每秒使用的平均 EECU 秒数的比率(无单位)。
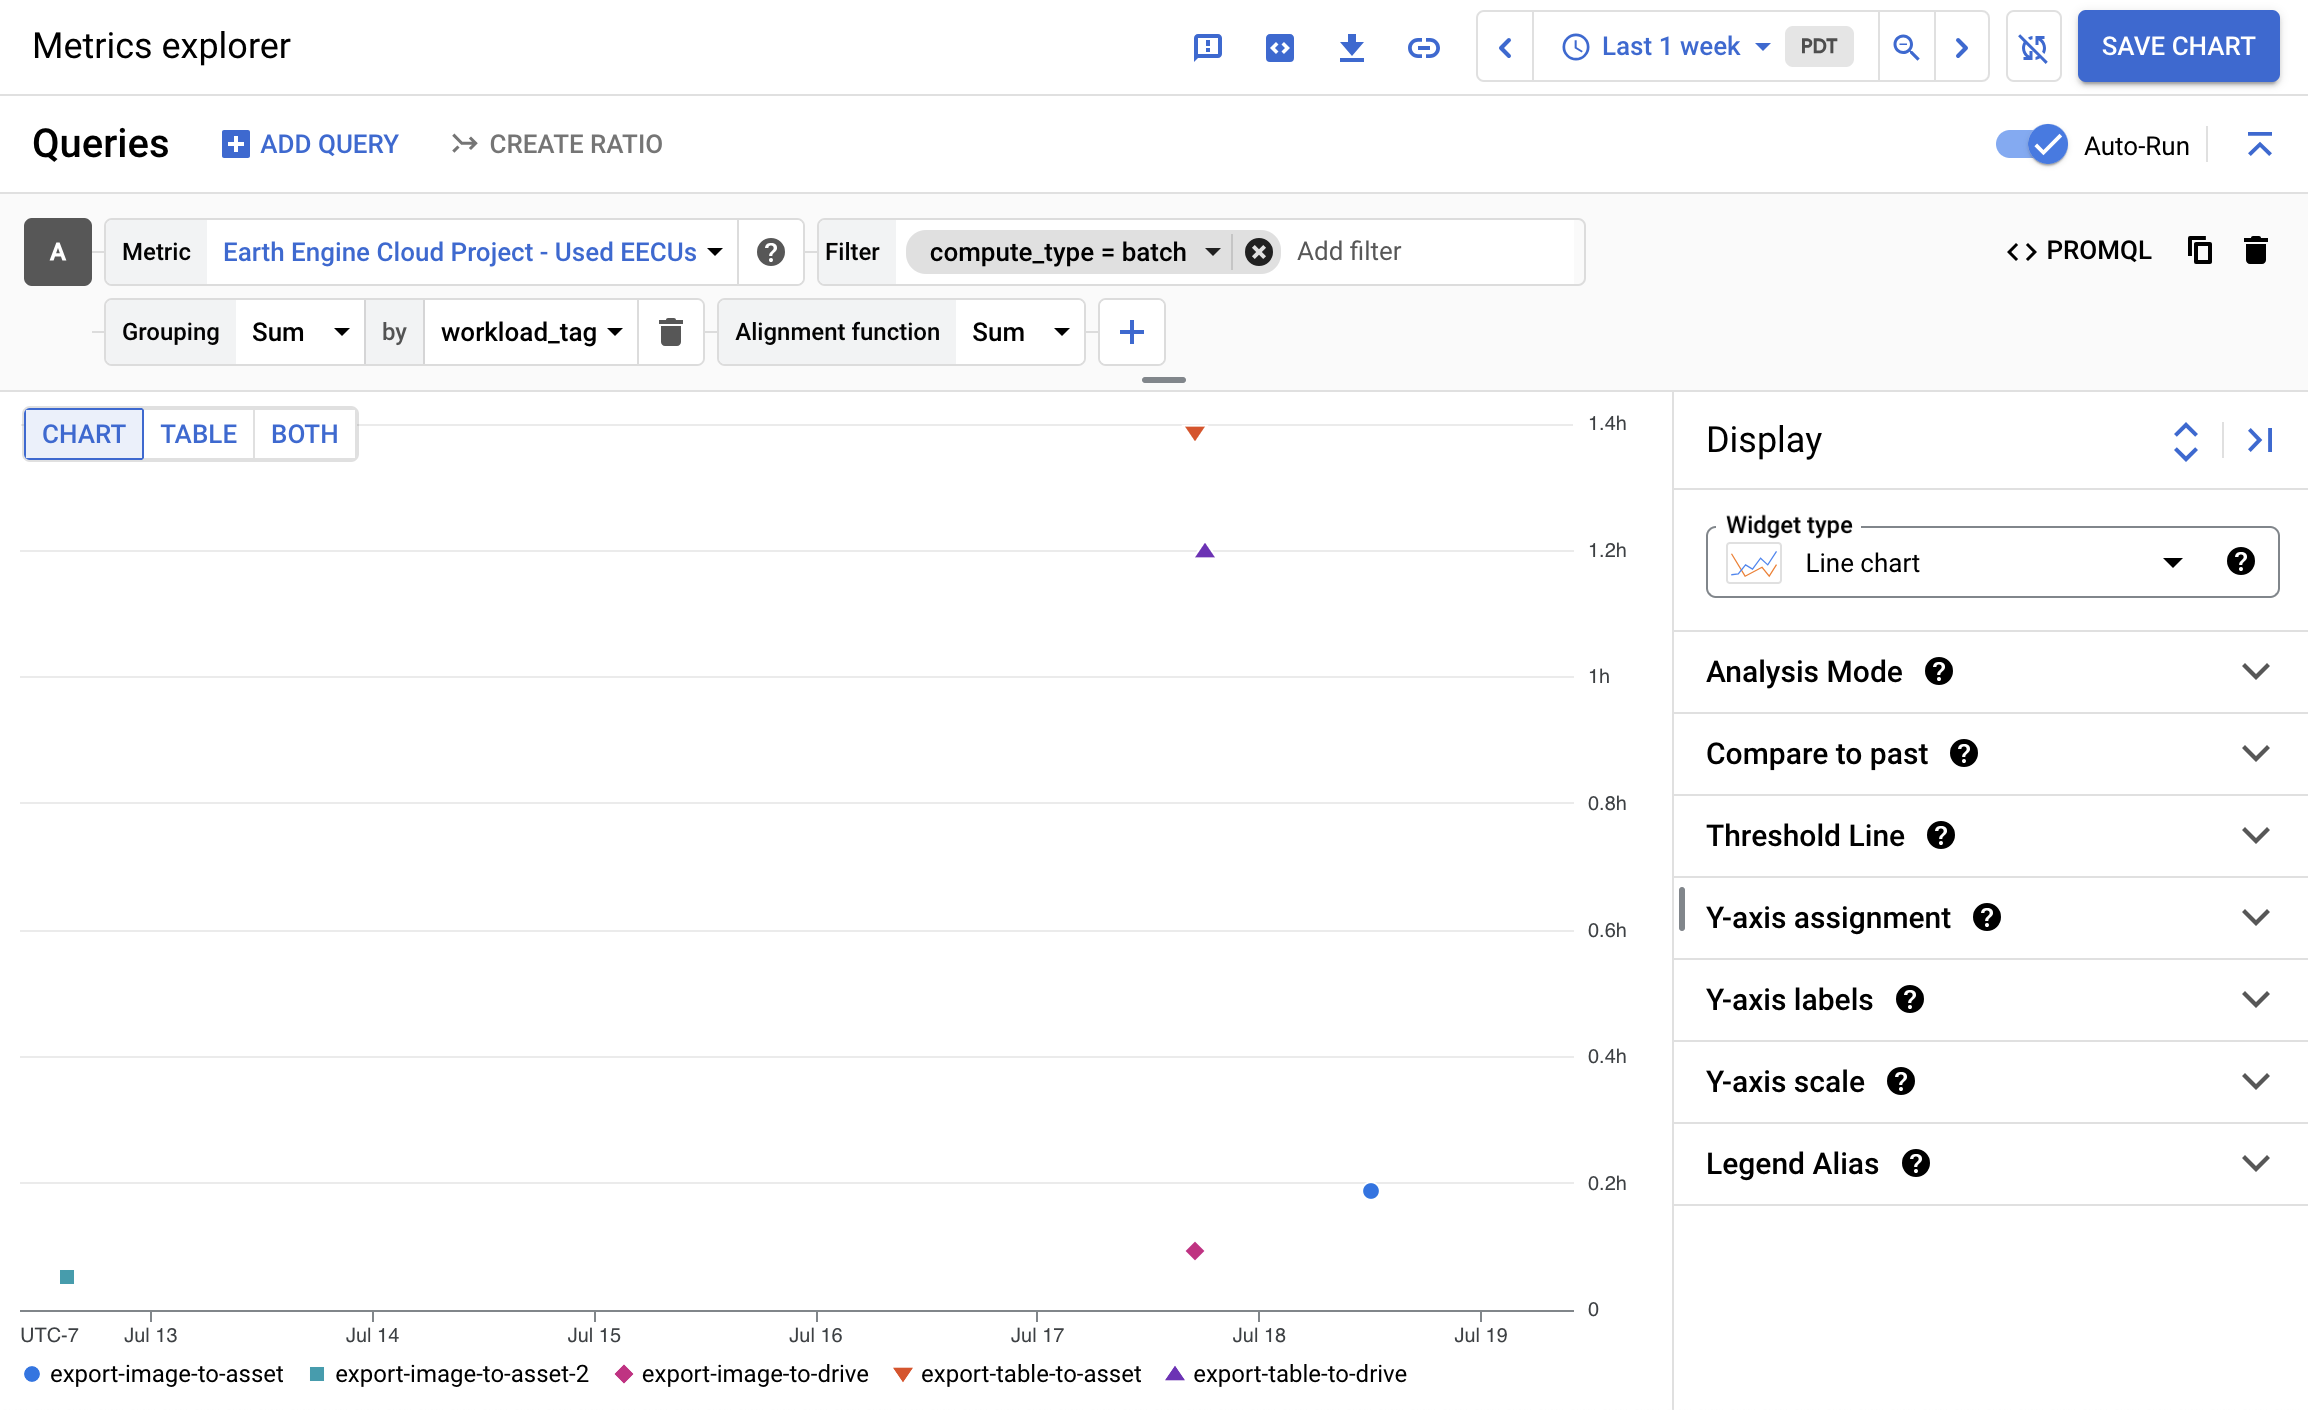
如需查看与显式单位一起使用的原始 EECU 时间,请点击查询中的 Aggregation 字段,然后从随即显示的菜单中选择“Configure aligner”。这会将汇总操作替换为两个新操作:分组和对齐函数。选择“分组:Sum”和“对齐函数:Sum”后,系统会构建一个带有明确单位的图表,表示每个数据点使用的总 EECU 时间。如需查看可能的校准器列表,请参阅 Aligner 参考文档。
工作负载标记
工作负载标记是用于监控 Earth Engine 中特定计算的标签。使用 setDefaultWorkloadTag 将脚本中的所有计算绑定到默认的工作负载标记,除非使用 ee.data.setWorkloadTag 明确设置了默认标记,在这种情况下,默认标记会被替换。这些方法会为特定计算和导出任务设置 workload_tag 标签。
然后,您可以使用 Earth Engine Cloud 项目 > 项目 > 已用 EECU 指标在 Metrics Explorer 中监控和跟踪添加了标记的计算,并按 workload_tag 进行分组或过滤。
例如,如需监控用于图像计算和/或导出的 EECU,请执行以下操作:
Code Editor (JavaScript)
// Set a default workload tag.
ee.data.setDefaultWorkloadTag('landsat-compositing')
var composite = ee.ImageCollection('LANDSAT/LC08/C02/T1_L2')
                     .filterDate('2020-01-01', '2021-01-01')
                     .median();

// Set a workload tag for export.
ee.data.setWorkloadTag('export-jobs');
Export.image.toAsset(composite);
ee.data.resetWorkloadTag(); // Reset to landsat-compositing

ee.data.resetWorkloadTag(true); // Reset back to empty
import ee
import geemap.core as geemap
Colab (Python)
# Authenticate, then initialize with your Cloud Project.
ee.Initialize(project='your-project')

# Set a default workload tag.
ee.data.setDefaultWorkloadTag('landsat-compositing')
composite = (
    ee.ImageCollection('LANDSAT/LC08/C02/T1_L2')
    .filterDate('2020-01-01', '2021-01-01')
    .median()
)

# Set a workload tag for export.
ee.data.setWorkloadTag('export-jobs')
ee.batch.Export.image.toAsset(composite).start()
ee.data.resetWorkloadTag()  # Reset to landsat-compositing

ee.data.resetWorkloadTag(True)  # Reset back to empty

# Alternatively, use a workload tag with the `with` context manager.
with ee.data.workloadTagContext('export-jobs'):
  ee.batch.Export.image.toAsset(composite).start()
在此示例中,所有计算都带有 landsat-compositing 标记(设为默认值),并且由于在运行导出之前调用了 ee.data.setWorkloadTag,因此导出内容会获得自己的工作负载标记。使用 ee.data.resetWorkloadTag 可将其设回默认代码,或将默认代码设回空字符串。