如需查找映像 ID,请使用代码编辑器顶部的搜索工具在 Earth Engine 数据目录中进行搜索。例如,在搜索字段中输入“高程”,然后注意系统会返回一个栅格列表。点击“SRTM 数字高程数据版本 4”条目,即可查看该数据集的更多信息。在数据集说明的右侧,有一个图片 ID 字段。请注意,示例中的图片 ID 是从数据集说明中显示的图片 ID 复制的。
除了复制和粘贴图片 ID 之外,您还可以使用数据集说明中的导入按钮或搜索结果右侧的导入链接。如果您点击导入链接或按钮,系统会在脚本顶部的特殊部分(名为 Imports)中自动创建一个变量。您可以通过点击导入部分中的变量名称来重命名该变量。
[null,null,["最后更新时间 (UTC):2025-07-27。"],[[["\u003cp\u003eThis tutorial introduces how to display raster data on the map in Earth Engine using JavaScript.\u003c/p\u003e\n"],["\u003cp\u003eYou will learn to use the \u003ccode\u003eee.Image()\u003c/code\u003e constructor to load an image by its ID from the data catalog.\u003c/p\u003e\n"],["\u003cp\u003eVisualization of the image layer can be customized by setting the minimum, maximum, and color palette using the \u003ccode\u003evisParams\u003c/code\u003e in \u003ccode\u003eMap.addLayer()\u003c/code\u003e.\u003c/p\u003e\n"],["\u003cp\u003eThe data type of an image and its properties can be explored using the \u003ccode\u003eprint()\u003c/code\u003e function and the Console tab.\u003c/p\u003e\n"],["\u003cp\u003eEarth Engine automatically stretches single-band images to a grayscale by default, which can be adjusted for better visualization.\u003c/p\u003e\n"]]],["The core content focuses on interacting with Earth Engine using JavaScript. Key actions include: using `ee.Image()` to instantiate an image from the data catalog, and finding images by searching the catalog or importing them. The `Map.setCenter()` method centers the map display, and `Map.addLayer()` adds an image to it. The visualization of the images can be customized using parameters to define a minimum, maximum value, and color palette.\n"],null,["# Visualizing Images and Image Bands\n\nNow that you're ready to begin writing Earth Engine JavaScript, start by copying the\nfollowing code into the Code Editor:\n\n### Code Editor (JavaScript)\n\n```javascript\n// Instantiate an image with the Image constructor.\nvar image = ee.Image('CGIAR/SRTM90_V4');\n\n// Zoom to a location.\nMap.setCenter(-112.8598, 36.2841, 9); // Center on the Grand Canyon.\n\n// Display the image on the map.\nMap.addLayer(image);\n```\n\nClick the **Run** button at the top of the Code Editor and observe that a\nvery gray image appears on the map. Don't worry, you'll make it look better soon. If\nthe syntax of any part of this example in unfamiliar, be sure to review the\n[JavaScript for Earth Engine tutorial](/earth-engine/tutorials/tutorial_js_01).\n\n### Image Constructor\n\nThe first new thing in this example is the [image constructor](/earth-engine/apidocs/ee-image)\n`ee.Image()`. The argument provided to the constructor is the string ID of an\nimage in the Earth Engine data catalog. (See the **Docs** tab, at the left\nof the Code Editor, to see a full list of possible arguments to the image constructor. The\n**Docs** tab represents the most up to date information about what Earth Engine\ncan do.)\n\nTo discover an image ID, search in the Earth Engine data catalog using the search tool\nat the top of the Code Editor. For example, type 'elevation' into the search field and\nnote that a list of rasters is returned. Click the 'SRTM Digital Elevation Data Version 4'\nentry to see more information about that dataset. On the right side of the dataset\ndescription is an **Image ID** field. Observe that the image ID in the\nexample is copied from the image ID shown in the dataset description.\n\nAn alternative to copying and pasting image IDs is to use the **Import**\nbutton on the dataset description or the **import** link at the right\nside of the search results. If you click the import link or button, a variable is\nautomatically created in a special section, named ['Imports'](/earth-engine/guides/playground#imports),\nat the top of your script. You can rename the variable by clicking on its name in the\nimports section.\n\n### Configuring the Map\n\nThe second new part of this example is the `Map.setCenter()` call. This\nmethod on the `Map` object, which represents the Map display in the Code\nEditor, centers the map at the given longitude, latitude (in decimal degrees) and\n[zoom\nlevel](https://developers.google.com/maps/documentation/javascript/tutorial#zoom-levels) where 1 is zoomed out so that the map shows the entire Earth's surface. Larger\nnumbers zoom in from there. Discover all the methods on the `Map` object by\nchecking the Map section in the [Docs tab](/earth-engine/guides/playground#api-reference-docs-tab)\non the left side of the Code Editor.\n\n### Adding a layer to the Map\n\nThe last line in the example says: use the `Map`object's `addLayer()`\nmethod to add an image to the map display in the Code Editor.\n\nCongratulations! You've created your first Earth Engine script. In the next section,\nyou'll learn how to make that image look a little better.\n\nDigression: Images in Earth Engine\n----------------------------------\n\nImages in Earth Engine (see [this page](/earth-engine/guides/image_overview) for more details) are\nmade up of one or more bands. Each band in an image has its own name, pixel values,\npixel resolution, and projection. As you'll soon discover, the SRTM image has one band:\n'elevation'.\n\nWhen you add an image to a map using `Map.addLayer()`, Earth Engine needs to\ndetermine how to map the values in the image band(s) to colors on the display. If a\nsingle-band image is added to a map, by default Earth Engine displays the band in grayscale,\nwhere the minimum value is assigned to black, and the maximum value is assigned to white.\nIf you don't specify what the minimum and maximum should be, Earth Engine will use\ndefault values. For example, the image you just added to the map is displayed as a\ngrayscale image stretched to the full range of the data, or signed 16-bit integer\n\\[-32768, 32767\\]. (`float` bands are stretched to \\[0, 1\\] and `byte`\nbands are stretched to \\[0, 255\\] by default).\n\nYou can discover the data type of the image by printing it and inspecting the image object\nin the **Console** tab. For example, paste the following after the previous\ncode:\n\n### Code Editor (JavaScript)\n\n```javascript\nprint('SRTM image', image);\n```\n\nWhen you click run, note that an object appears in the console. To investigate the object\nproperties, expand it by clicking on the zippy\n() to the left of the\nobject or property. Expand the image object, the 'bands' property, the 'elevation' band\nat index '0' and the 'data_type' property of the 'elevation' band to discover that it is a\n`signed int16` data type.\n\nCustomizing layer visualization\n-------------------------------\n\nTo change the way the data are stretched, you can provide another parameter to the\n`Map.addLayer()` call. Specifically, the second parameter,\n`visParams`, lets you specify the minimum and maximum values to display. To\ndiscover what values to use, activate the\n[**Inspector** tab](/earth-engine/guides/playground#inspector-tab) and click around on\nthe map to get an idea of the range of pixel values. Alternatively, use the\n[Layer manager](/earth-engine/guides/playground#layer-manager) to interactively stretch the data,\nthen observe the minimum and maximum corresponding to percentiles or standard deviation\nstretches. Suppose that through such experimentation, you determine that the data\nshould be stretched to \\[0, 3000\\]. To display the image using this range, use:\n\n### Code Editor (JavaScript)\n\n```javascript\n
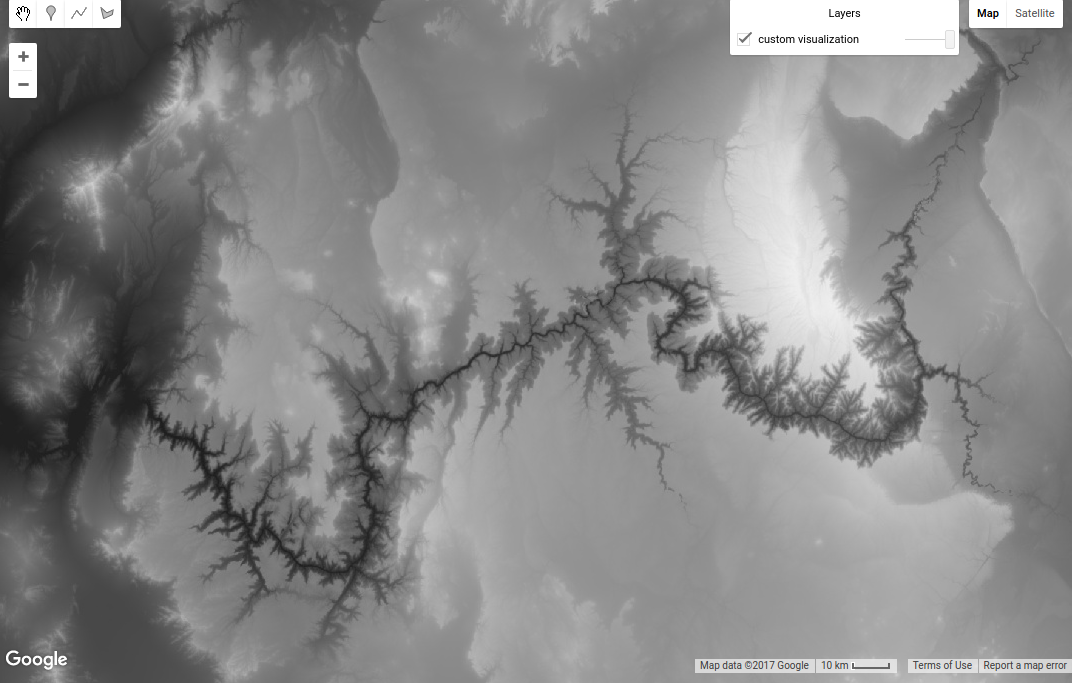
Map.addLayer(image, {min: 0, max: 3000}, 'custom visualization');\n```\n\nNote that the `visParams` parameter is an object, with properties specifying\nthe `min` and the `max`. (Learn more about JavaScript objects from\n[the JavaScript tutorial](/earth-engine/tutorials/tutorial_js_01#basic-javascript-data-types) or\n[this\nexternal reference](https://developer.mozilla.org/en-US/docs/Web/JavaScript/Guide/Working_with_Objects)). Note that the third parameter for `Map.addLayer()`\nis the name of the layer that is displayed in the [Layer\nmanager](/earth-engine/guides/playground#layer-manager). The result should look something like Figure 1. Hover the mouse over the\n**Layers** box on the right to see the effect of renaming that layer.\nFigure 1. Elevation image as grayscale, stretched to \\[0, 3000\\].\n\nTo display a single band using a color palette, add a `palette` property\nto the `visParams` object:\n\n### Code Editor (JavaScript)\n\n```javascript\n
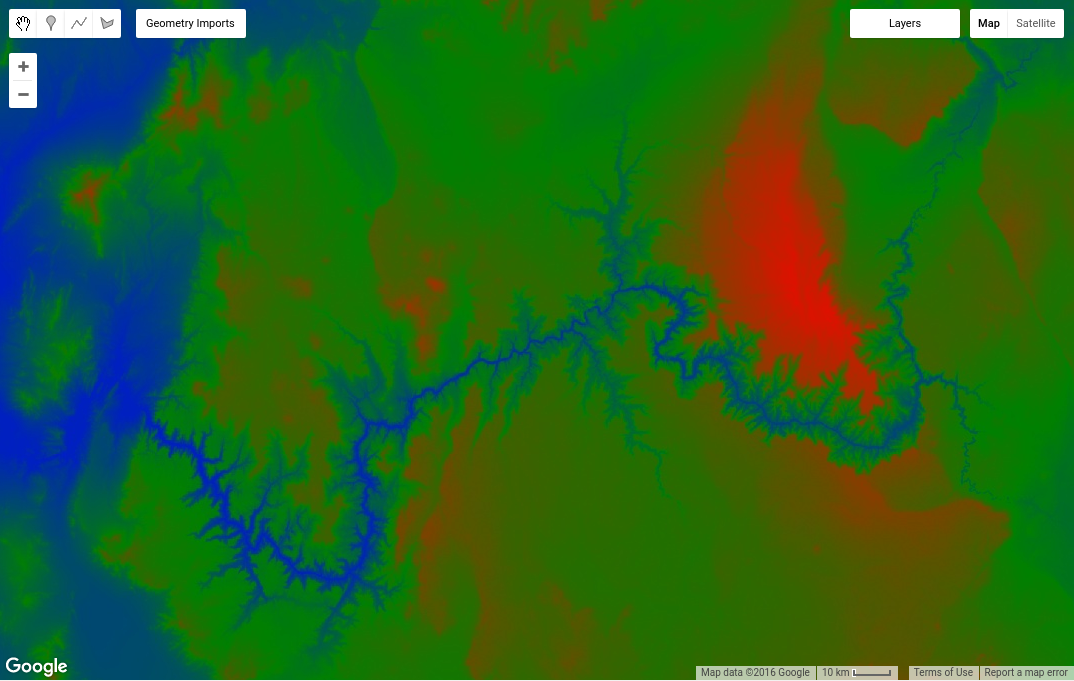
Map.addLayer(image, {min: 0, max: 3000, palette: ['blue', 'green', 'red']},\n 'custom palette');\n```\n\nThe result should look something like Figure 2.\nFigure 2. Elevation image as a color ramp from blue to red, stretched to \\[0, 3000\\].\n\nDigression: Palettes\n--------------------\n\nPalettes let you set the color scheme for single-band images. A palette is a comma\ndelimited list of color strings which are linearly interpolated between the maximum and\nminimum values in the visualization parameters (or defaults according to the band type,\nas described previously). For example, pixels less than or equal to the minimum will\nbe displayed with the first color in the list; pixels greater than or equal to the\nmaximum will be displayed with the last color in the list. Intermediate colors are\nlinearly stretched to intermediate pixel values.\n\nThe colors are defined using the web standard CSS color value scheme (see\n[this external reference](https://en.wikipedia.org/wiki/Web_colors) to learn\nmore). Colors can be specified by name or as hexadecimal strings indicating the\ncombination of red, green and blue. The lowest value in any of the three positions is 00\n(representing the decimal number 0), while the highest is FF (representing the decimal\nnumber 255). The string '000000' represents the color black, 'FFFFFF' is white, 'FF0000'\nis red, '00FF00' is green, and '0000FF' is blue. See the\n[Color palettes section](/earth-engine/guides/image_visualization#color-palettes) for more detail.\nOther stretches are possible by using Styled Layer Descriptors, as described in\n[this section](/earth-engine/guides/image_visualization#styled-layer-descriptors).\n\nLater in this tutorial, you'll learn how to display multi-band imagery. But first,\nvisit the next page to learn about performing computations with images. \n[arrow_backPrevious page](/earth-engine/tutorials/tutorial_api_01) [Next pagearrow_forward](/earth-engine/tutorials/tutorial_api_03)"]]