 前往 GitHub 查看來源
圖片物件是一組連結的像素,具有相同的整數值。分類、分箱和布林值圖像資料適合用於物件分析。
Earth Engine 提供方法,可為每個物件加上唯一 ID、計算組成物件的像素數量,以及計算與物件相交的像素值統計資料。
connectedComponents():為每個物件加上專屬 ID。connectedPixelCount():計算每個物件的像素數量。reduceConnectedComponents():計算每個物件中像素的統計資料。
熱點
以下各節提供將物件為基礎的方法套用至 Landsat 8 地表溫度的範例,每個部分都會以前一個部分為基礎。執行下列程式碼片段,產生基本圖片:舊金山某小區域的熱點 (超過 303 開氏度)。
程式碼編輯器 (JavaScript)
// Make an area of interest geometry centered on San Francisco.
var point = ee.Geometry.Point(-122.1899, 37.5010);
var aoi = point.buffer(10000);

// Import a Landsat 8 image, subset the thermal band, and clip to the
// area of interest.
var kelvin = ee.Image('LANDSAT/LC08/C02/T1_TOA/LC08_044034_20140318')
  .select(['B10'], ['kelvin'])
  .clip(aoi);

// Display the thermal band.
Map.centerObject(point, 13);
Map.addLayer(kelvin, {min: 288, max: 305}, 'Kelvin');

// Threshold the thermal band to set hot pixels as value 1, mask all else.
var hotspots = kelvin.gt(303)
  .selfMask()
  .rename('hotspots');

// Display the thermal hotspots on the Map.
Map.addLayer(hotspots, {palette: 'FF0000'}, 'Hotspots');
import ee
import geemap.core as geemap
Colab (Python)
# Make an area of interest geometry centered on San Francisco.
point = ee.Geometry.Point(-122.1899, 37.5010)
aoi = point.buffer(10000)

# Import a Landsat 8 image, subset the thermal band, and clip to the
# area of interest.
kelvin = (
    ee.Image('LANDSAT/LC08/C02/T1_TOA/LC08_044034_20140318')
    .select(['B10'], ['kelvin'])
    .clip(aoi)
)

# Threshold the thermal band to set hot pixels as value 1, mask all else.
hotspots = kelvin.gt(303).selfMask().rename('hotspots')

# Define a map centered on Redwood City, California.
map_objects = geemap.Map(center=[37.5010, -122.1899], zoom=13)

# Add the image layers to the map.
map_objects.add_layer(kelvin, {'min': 288, 'max': 305}, 'Kelvin')
map_objects.add_layer(hotspots, {'palette': 'FF0000'}, 'Hotspots')

圖 1. 舊金山某區域的溫度。溫度超過 303 開氏溫度的像素會以紅色標示 (熱點)。
標籤物件
物件分析的第一步通常是標記物件。此處使用 connectedComponents() 函式來識別圖片物件,並為每個物件指派專屬 ID;屬於某個物件的所有像素都會指派相同的整數 ID 值。結果是輸入圖像的副本,其中包含額外的「標籤」頻帶,可根據圖像第一個頻帶中的像素連結性,將像素與物件 ID 值建立關聯。
程式碼編輯器 (JavaScript)
// Uniquely label the hotspot image objects.
var objectId = hotspots.connectedComponents({
  connectedness: ee.Kernel.plus(1),
  maxSize: 128
});

// Display the uniquely ID'ed objects to the Map.
Map.addLayer(objectId.randomVisualizer(), null, 'Objects');
import ee
import geemap.core as geemap
Colab (Python)
# Uniquely label the hotspot image objects.
object_id = hotspots.connectedComponents(
    connectedness=ee.Kernel.plus(1), maxSize=128
)

# Add the uniquely ID'ed objects to the map.
map_objects.add_layer(object_id.randomVisualizer(), None, 'Objects')
請注意,最大修補大小已設為 128 像素;由更多像素組成的物件會遭到遮蔽。連線是由 ee.Kernel.plus(1) 核心指定,可定義四鄰接連線;使用 ee.Kernel.square(1) 可進行八鄰接連線。
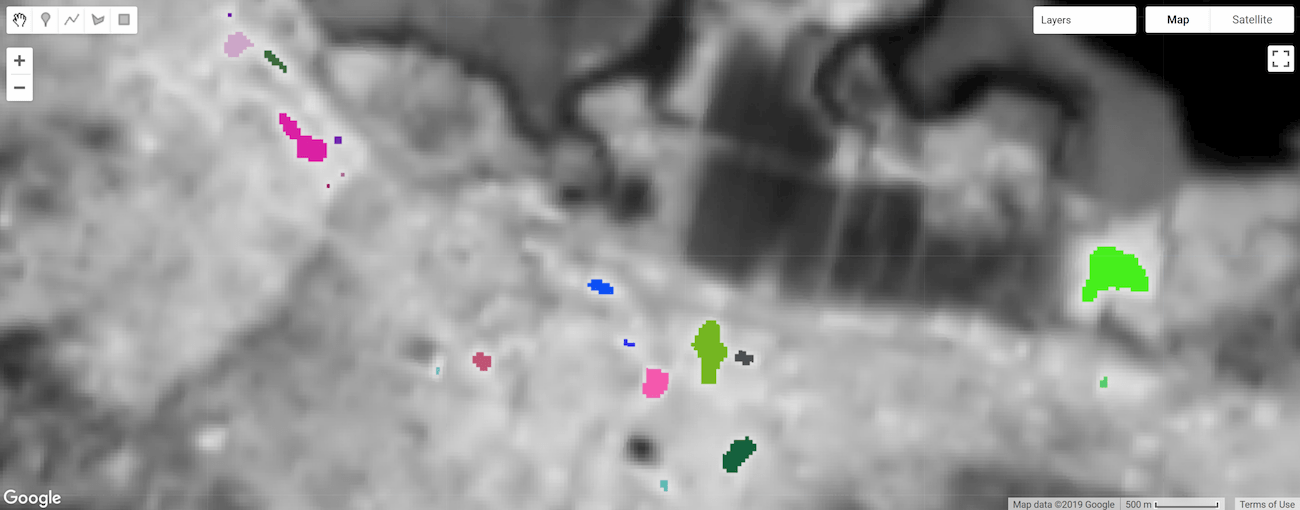
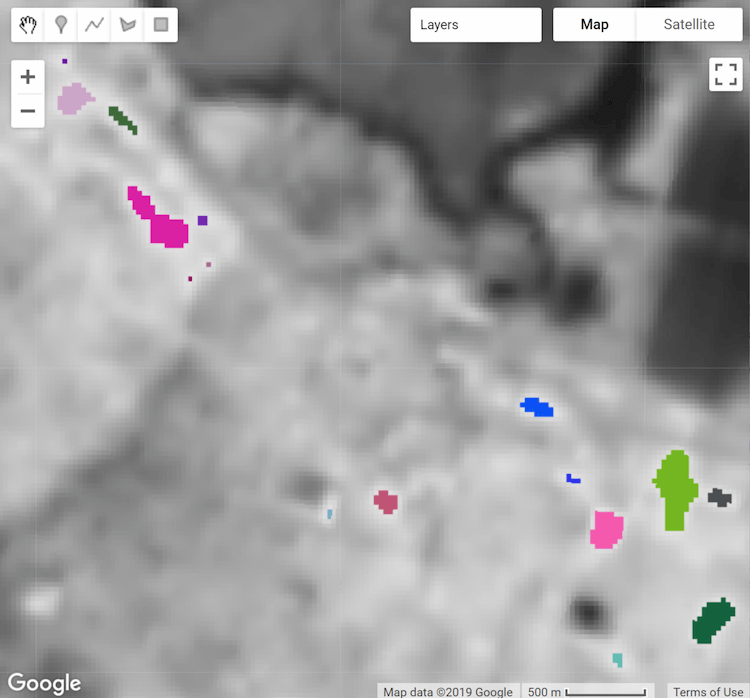
圖 2. 熱點熱點物件,標示和樣式皆以專屬 ID 為依據。
物件大小
像素數量
使用 connectedPixelCount() 圖片方法,計算組成物件的像素數量。瞭解物件中的像素數量,有助於依大小遮蔽物件,並計算物件面積。以下程式碼片段會將 connectedPixelCount() 套用至上一節定義的 objectId 圖片的「labels」頻帶。
程式碼編輯器 (JavaScript)
// Compute the number of pixels in each object defined by the "labels" band.
var objectSize = objectId.select('labels')
  .connectedPixelCount({
    maxSize: 128, eightConnected: false
  });

// Display object pixel count to the Map.
Map.addLayer(objectSize, null, 'Object n pixels');
import ee
import geemap.core as geemap
Colab (Python)
# Compute the number of pixels in each object defined by the "labels" band.
object_size = object_id.select('labels').connectedPixelCount(
    maxSize=128, eightConnected=False
)

# Add the object pixel count to the map.
map_objects.add_layer(object_size, None, 'Object n pixels')
connectedPixelCount() 會傳回輸入圖片的副本,其中每個頻帶的每個像素都會根據傳遞至 eightConnected 參數的布林值引數所決定的四鄰或八鄰連通性規則,包含連結鄰居的數量。請注意,系統會針對輸入圖片的每個頻帶分別決定連通性。在這個範例中,系統會以代表物件 ID 的單一頻帶圖片 (objectId) 做為輸入,因此會傳回含有「標籤」頻帶的單一頻帶圖片 (在輸入圖片中顯示為此類),但現在的值代表組成物件的像素數量;每個物件的每個像素都會具有相同的像素計數值。

圖 3. 熱點熱點物件,並根據大小標示和設定樣式。
區
計算物件區域時,請將單一像素的區域乘以組成物件的像素數量 (由 connectedPixelCount() 決定)。像素區域是由 ee.Image.pixelArea() 產生的圖片提供。
程式碼編輯器 (JavaScript)
// Get a pixel area image.
var pixelArea = ee.Image.pixelArea();

// Multiply pixel area by the number of pixels in an object to calculate
// the object area. The result is an image where each pixel
// of an object relates the area of the object in m^2.
var objectArea = objectSize.multiply(pixelArea);

// Display object area to the Map.
Map.addLayer(objectArea,
             {min: 0, max: 30000, palette: ['0000FF', 'FF00FF']},
             'Object area m^2');
import ee
import geemap.core as geemap
Colab (Python)
# Get a pixel area image.
pixel_area = ee.Image.pixelArea()

# Multiply pixel area by the number of pixels in an object to calculate
# the object area. The result is an image where each pixel
# of an object relates the area of the object in m^2.
object_area = object_size.multiply(pixel_area)

# Add the object area to the map.
map_objects.add_layer(
    object_area,
    {'min': 0, 'max': 30000, 'palette': ['0000FF', 'FF00FF']},
    'Object area m^2',
)
結果是圖片,其中物件的每個像素都與物件的平方公尺面積相關聯。在這個範例中,objectSize 圖片包含單一頻帶,如果是多頻帶,則乘法運算會套用至圖片的每個頻帶。
依大小篩選物件
物件大小可做為遮罩條件,讓分析作業著重於特定大小的物件 (例如遮罩過小物件)。在此,我們使用先前步驟計算的 objectArea 圖片做為遮罩,移除面積小於一公頃的物件。
程式碼編輯器 (JavaScript)
// Threshold the `objectArea` image to define a mask that will mask out
// objects below a given size (1 hectare in this case).
var areaMask = objectArea.gte(10000);

// Update the mask of the `objectId` layer defined previously using the
// minimum area mask just defined.
objectId = objectId.updateMask(areaMask);
Map.addLayer(objectId, null, 'Large hotspots');
import ee
import geemap.core as geemap
Colab (Python)
# Threshold the `object_area` image to define a mask that will mask out
# objects below a given size (1 hectare in this case).
area_mask = object_area.gte(10000)

# Update the mask of the `object_id` layer defined previously using the
# minimum area mask just defined.
object_id = object_id.updateMask(area_mask)
map_objects.add_layer(object_id, None, 'Large hotspots')
結果是 objectId 圖片的副本,其中會遮蓋小於一公頃的物件。
 |
 |
|---|---|
| 圖 4a. 熱點熱像物件,標示並以專屬 ID 設定樣式。 | 圖 4b. 根據最小面積 (1 公頃) 篩選的熱點物件。 |
區域統計資料
reduceConnectedComponents() 方法會將縮減器套用至組成獨特物件的像素。下列程式碼片段會使用此方法計算熱點物件的平均溫度。reduceConnectedComponents() 需要輸入圖像,其中包含要縮減的頻帶 (或頻帶),以及定義物件標籤的頻帶。在此處,將 objectID「標籤」圖像頻帶新增至 kelvin 溫度圖像,以建構適當的輸入圖像。
程式碼編輯器 (JavaScript)
// Make a suitable image for `reduceConnectedComponents()` by adding a label
// band to the `kelvin` temperature image.
kelvin = kelvin.addBands(objectId.select('labels'));

// Calculate the mean temperature per object defined by the previously added
// "labels" band.
var patchTemp = kelvin.reduceConnectedComponents({
  reducer: ee.Reducer.mean(),
  labelBand: 'labels'
});

// Display object mean temperature to the Map.
Map.addLayer(
  patchTemp,
  {min: 303, max: 304, palette: ['yellow', 'red']},
  'Mean temperature'
);
import ee
import geemap.core as geemap
Colab (Python)
# Make a suitable image for `reduceConnectedComponents()` by adding a label
# band to the `kelvin` temperature image.
kelvin = kelvin.addBands(object_id.select('labels'))

# Calculate the mean temperature per object defined by the previously added
# "labels" band.
patch_temp = kelvin.reduceConnectedComponents(
    reducer=ee.Reducer.mean(), labelBand='labels'
)

# Add object mean temperature to the map and display it.
map_objects.add_layer(
    patch_temp,
    {'min': 303, 'max': 304, 'palette': ['yellow', 'red']},
    'Mean temperature',
)
display(map_objects)
結果是輸入圖片的副本,不含用於定義物件的頻帶,其中像素值代表每個物件和每個頻帶的縮減結果。

圖 5. 熱點物件像素會根據平均溫度匯總並套用樣式。