คุณสามารถรวมคอลเล็กชันตามตำแหน่งเชิงพื้นที่และตามค่าพร็อพเพอร์ตี้ได้ หากต้องการรวมตามตำแหน่งเชิงพื้นที่ ให้ใช้ตัวกรอง withinDistance() ที่มีฟิลด์การรวม .geo ที่ระบุ ช่อง .geo ระบุว่าจะใช้เรขาคณิตของรายการเพื่อคํานวณเมตริกระยะทาง ตัวอย่างเช่น ให้พิจารณางานค้นหา
โรงไฟฟ้าทั้งหมดภายในรัศมี 100 กิโลเมตรจากอุทยานแห่งชาติโยเซมิตีในสหรัฐอเมริกา ด้วยเหตุนี้ ให้ใช้ตัวกรองในช่องเรขาคณิต โดยตั้งค่าระยะทางสูงสุดเป็น 100 กิโลเมตรโดยใช้พารามิเตอร์ distance ดังนี้
เครื่องมือแก้ไขโค้ด (JavaScript)
// Load a primary collection: protected areas (Yosemite National Park).
var primary = ee.FeatureCollection("WCMC/WDPA/current/polygons")
  .filter(ee.Filter.eq('NAME', 'Yosemite National Park'));

// Load a secondary collection: power plants.
var powerPlants = ee.FeatureCollection('WRI/GPPD/power_plants');

// Define a spatial filter, with distance 100 km.
var distFilter = ee.Filter.withinDistance({
  distance: 100000,
  leftField: '.geo',
  rightField: '.geo',
  maxError: 10
});

// Define a saveAll join.
var distSaveAll = ee.Join.saveAll({
  matchesKey: 'points',
  measureKey: 'distance'
});

// Apply the join.
var spatialJoined = distSaveAll.apply(primary, powerPlants, distFilter);

// Print the result.
print(spatialJoined);
import ee
import geemap.core as geemap
Colab (Python)
# Load a primary collection: protected areas (Yosemite National Park).
primary = ee.FeatureCollection('WCMC/WDPA/current/polygons').filter(
    ee.Filter.eq('NAME', 'Yosemite National Park')
)

# Load a secondary collection: power plants.
power_plants = ee.FeatureCollection('WRI/GPPD/power_plants')

# Define a spatial filter, with distance 100 km.
dist_filter = ee.Filter.withinDistance(
    distance=100000, leftField='.geo', rightField='.geo', maxError=10
)

# Define a saveAll join.
dist_save_all = ee.Join.saveAll(matchesKey='points', measureKey='distance')

# Apply the join.
spatial_joined = dist_save_all.apply(primary, power_plants, dist_filter)

# Print the result.
display(spatial_joined)
โปรดทราบว่าตัวอย่างก่อนหน้านี้จะรวม FeatureCollection เข้ากับ FeatureCollection อื่น การเข้าร่วม saveAll() จะตั้งค่าพร็อพเพอร์ตี้ (points) ให้กับองค์ประกอบแต่ละรายการในคอลเล็กชัน primary ซึ่งจะจัดเก็บรายการจุดที่อยู่ภายใน 100 กิโลเมตรขององค์ประกอบ ระบบจะจัดเก็บระยะทางของจุดแต่ละจุดไปยังองค์ประกอบในพร็อพเพอร์ตี้ distance ของจุดที่เข้าร่วมแต่ละจุด
นอกจากนี้ คุณยังใช้การรวมเชิงพื้นที่เพื่อระบุองค์ประกอบในคอลเล็กชันหนึ่งซึ่งตัดกับองค์ประกอบในอีกคอลเล็กชันหนึ่งได้ด้วย ตัวอย่างเช่น ลองพิจารณาคอลเล็กชันองค์ประกอบ 2 คอลเล็กชัน ได้แก่ คอลเล็กชัน primary ที่มีรูปหลายเหลี่ยมแสดงขอบเขตของรัฐในสหรัฐอเมริกา และคอลเล็กชัน secondary ที่มีตำแหน่งจุดแสดงโรงไฟฟ้า สมมติว่าจำเป็นต้องระบุจำนวนที่ตัดกันในแต่ละรัฐ ซึ่งทําได้ด้วยการรวมเชิงพื้นที่ ดังนี้
เครื่องมือแก้ไขโค้ด (JavaScript)
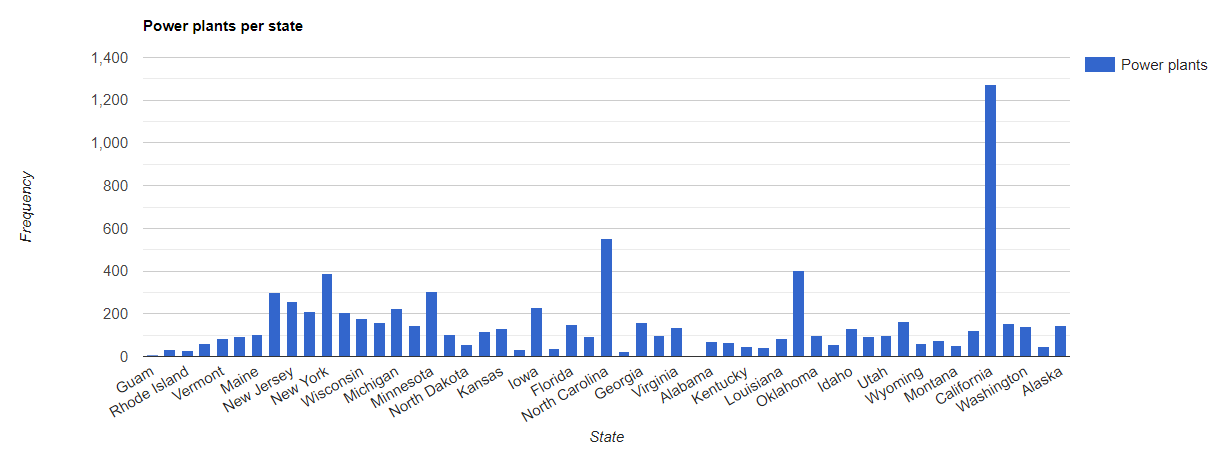
// Load the primary collection: US state boundaries.
var states = ee.FeatureCollection('TIGER/2018/States');

// Load the secondary collection: power plants.
var powerPlants = ee.FeatureCollection('WRI/GPPD/power_plants');

// Define a spatial filter as geometries that intersect.
var spatialFilter = ee.Filter.intersects({
  leftField: '.geo',
  rightField: '.geo',
  maxError: 10
});

// Define a save all join.
var saveAllJoin = ee.Join.saveAll({
  matchesKey: 'power_plants',
});

// Apply the join.
var intersectJoined = saveAllJoin.apply(states, powerPlants, spatialFilter);

// Add power plant count per state as a property.
intersectJoined = intersectJoined.map(function(state) {
  // Get "power_plant" intersection list, count how many intersected this state.
  var nPowerPlants = ee.List(state.get('power_plants')).size();
  // Return the state feature with a new property: power plant count.
  return state.set('n_power_plants', nPowerPlants);
});

// Make a bar chart for the number of power plants per state.
var chart = ui.Chart.feature.byFeature(intersectJoined, 'NAME', 'n_power_plants')
  .setChartType('ColumnChart')
  .setSeriesNames({n_power_plants: 'Power plants'})
  .setOptions({
    title: 'Power plants per state',
    hAxis: {title: 'State'},
    vAxis: {title: 'Frequency'}});

// Print the chart to the console.
print(chart);
ในตัวอย่างก่อนหน้านี้ โปรดทราบว่าตัวกรอง intersects() ไม่ได้จัดเก็บระยะทางเหมือนตัวกรอง withinDistance() เอาต์พุตควรมีลักษณะคล้ายกับรูปที่ 1