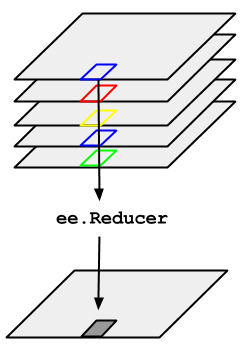
ImageCollection로 표시된 이미지의 시계열에서 중간값을 취해야 하는 예를 생각해 보겠습니다. ImageCollection를 줄이려면 imageCollection.reduce()를 사용합니다. 이렇게 하면 이미지 모음이 그림 1과 같이 개별 이미지로 축소됩니다. 구체적으로 출력은 픽셀 단위로 계산되므로 출력의 각 픽셀은 해당 위치에 있는 컬렉션의 모든 이미지의 중간값으로 구성됩니다. 평균, 합계, 분산, 임의 백분위수와 같은 다른 통계를 가져오려면 적절한 감소기를 선택하고 적용해야 합니다. 현재 사용 가능한 모든 리듀서의 목록은 코드 편집기의 문서 탭을 참고하세요. 최솟값, 최댓값, 평균과 같은 기본 통계의 경우
ImageCollection에는 min(), max(), mean()와 같은 바로가기 메서드가 있습니다. 이러한 메서드는 reduce()를 호출하는 것과 정확히 동일한 방식으로 작동하지만 결과 밴드 이름에 리듀서의 이름이 추가되지는 않습니다.
그림 1. ImageCollection에 적용된 ee.Reducer의 그림
ImageCollection 축소의 예로 경로 및 행별로 필터링된 Landsat 5 이미지 모음을 생각해 보겠습니다. 다음 코드는 reduce()를 사용하여 컬렉션을 하나의 Image로 줄입니다. 여기서 중간값 감소기는 설명 목적으로만 사용됩니다.
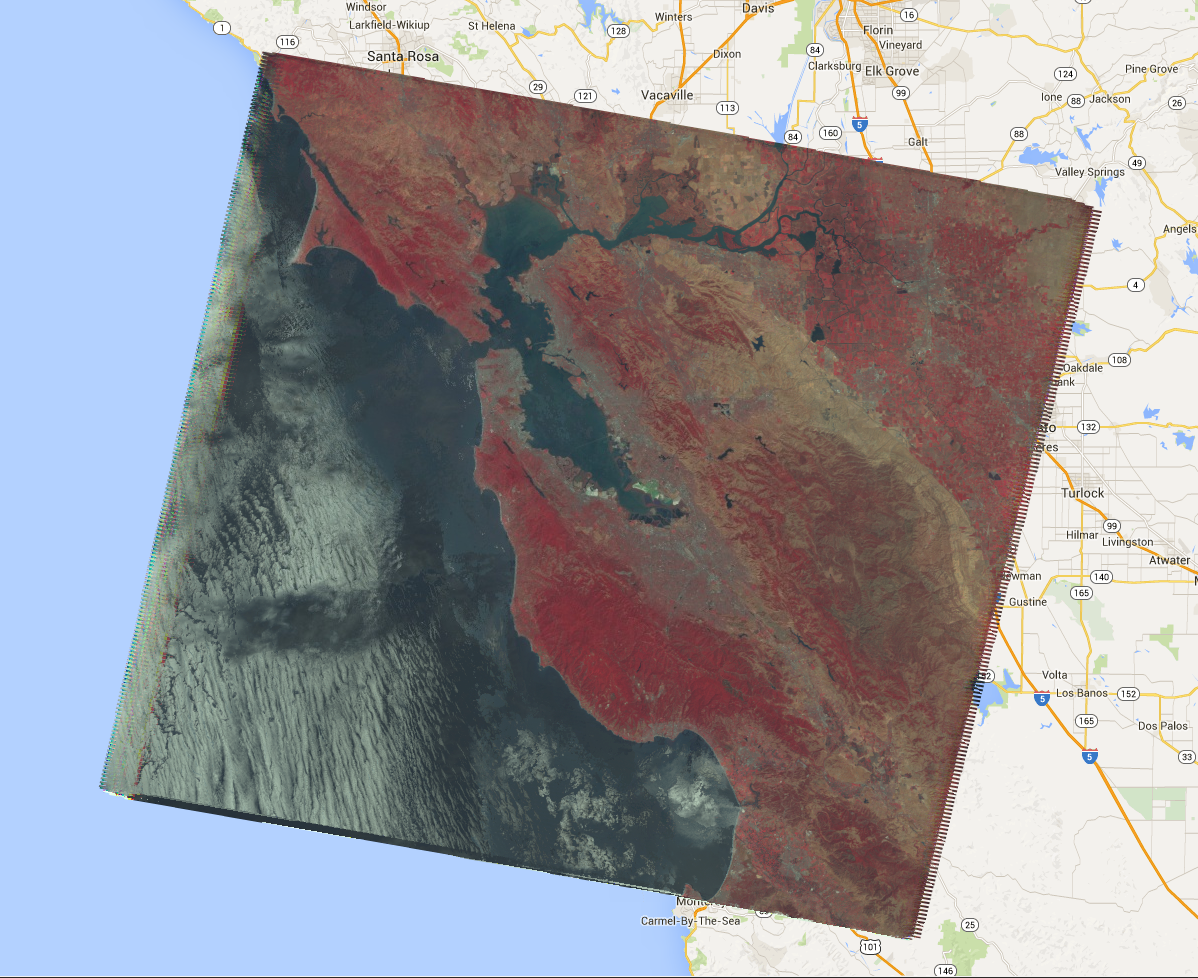
이렇게 하면 멀티밴드 Image가 반환되며, 각 픽셀은 해당 픽셀 위치의 ImageCollection에서 마스크가 적용되지 않은 모든 픽셀의 중앙값입니다. 구체적으로, 입력 이미지의 각 밴드에 대해 감소기가 반복되었으므로 각 밴드에서 중간값이 독립적으로 계산됩니다. 밴드 이름에 'B1_median', 'B2_median' 등의 감소자의 이름이 추가됩니다. 출력은 그림 2와 같이 표시됩니다.
이미지 컬렉션 축소에 관한 자세한 내용은 ImageCollection 문서의 축소 섹션을 참고하세요. 특히 ImageCollection를 줄여서 생성된 이미지에는 프로젝션이 없습니다. 즉, ImageCollection 감소에 의해 계산된 이미지 출력이 포함된 모든 계산에서 배율을 명시적으로 설정해야 합니다.
[null,null,["최종 업데이트: 2025-07-25(UTC)"],[[["\u003cp\u003eUse \u003ccode\u003eimageCollection.reduce()\u003c/code\u003e to reduce an \u003ccode\u003eImageCollection\u003c/code\u003e to a single image by applying a reducer function pixel-wise.\u003c/p\u003e\n"],["\u003cp\u003eEarth Engine provides built-in reducers for common statistics like median, mean, min, max, and more.\u003c/p\u003e\n"],["\u003cp\u003eThe output of \u003ccode\u003ereduce()\u003c/code\u003e is a multi-band image where each pixel represents the reduced value across the input images.\u003c/p\u003e\n"],["\u003cp\u003eBand names in the output image are appended with the reducer name (e.g., \u003ccode\u003eB1_median\u003c/code\u003e).\u003c/p\u003e\n"],["\u003cp\u003eReduced images have no projection, requiring explicit scale setting for further computations.\u003c/p\u003e\n"]]],[],null,["# ImageCollection Reductions\n\nConsider the example of needing to take the median over a time series of images\nrepresented by an `ImageCollection`. To reduce an `ImageCollection`,\nuse `imageCollection.reduce()`. This reduces the collection of images to an\nindividual image as illustrated in Figure 1. Specifically, the output is computed\npixel-wise, such that each pixel in the output is composed of the median value of all the\nimages in the collection at that location. To get other statistics, such as mean, sum,\nvariance, an arbitrary percentile, etc., the appropriate reducer should be selected and\napplied. (See the **Docs** tab in the\n[Code Editor](https://code.earthengine.google.com) for a list of all the reducers\ncurrently available). For basic statistics like min, max, mean, etc.,\n`ImageCollection` has shortcut methods like `min()`,\n`max()`, `mean()`, etc. They function in exactly the same way\nas calling `reduce()`, except the resultant band names will not have the\nname of the reducer appended.\nFigure 1. Illustration of an ee.Reducer applied to an ImageCollection.\n\nFor an example of reducing an `ImageCollection`, consider a collection of\nLandsat 5 images, filtered by path and row. The following code uses `reduce()`\nto reduce the collection to one `Image` (here a median reducer is used simply\nfor illustrative purposes):\n\n### Code Editor (JavaScript)\n\n```javascript\n// Load an image collection, filtered so it's not too much data.\nvar collection = ee.ImageCollection('LANDSAT/LT05/C02/T1')\n .filterDate('2008-01-01', '2008-12-31')\n .filter(ee.Filter.eq('WRS_PATH', 44))\n .filter(ee.Filter.eq('WRS_ROW', 34));\n\n// Compute the median in each band, each pixel.\n// Band names are B1_median, B2_median, etc.\nvar median = collection.reduce(ee.Reducer.median());\n\n// The output is an Image. Add it to the map.\nvar vis_param = {bands: ['B4_median', 'B3_median', 'B2_median'], gamma: 1.6};\nMap.setCenter(-122.3355, 37.7924, 9);\nMap.addLayer(median, vis_param);\n```\nPython setup\n\nSee the [Python Environment](/earth-engine/guides/python_install) page for information on the Python API and using\n`geemap` for interactive development. \n\n```python\nimport ee\nimport geemap.core as geemap\n```\n\n### Colab (Python)\n\n```python\n# Load an image collection, filtered so it's not too much data.\ncollection = (\n ee.ImageCollection('LANDSAT/LT05/C02/T1')\n .filterDate('2008-01-01', '2008-12-31')\n .filter(ee.Filter.eq('WRS_PATH', 44))\n .filter(ee.Filter.eq('WRS_ROW', 34))\n)\n\n# Compute the median in each band, each pixel.\n# Band names are B1_median, B2_median, etc.\nmedian = collection.reduce(ee.Reducer.median())\n\n# The output is an Image. Add it to the map.\nvis_param = {'bands': ['B4_median', 'B3_median', 'B2_median'], 'gamma': 1.6}\nm = geemap.Map()\nm.set_center(-122.3355, 37.7924, 9)\nm.add_layer(median, vis_param)\nm\n```\n\nThis returns a multi-band `Image`, each pixel of which is the median of all\nunmasked pixels in the `ImageCollection` at that pixel location. Specifically,\nthe reducer has been repeated for each band of the input imagery, meaning that the median\nis computed independently in each band. Note that the band names have the name of the\nreducer appended: `'B1_median'`, `'B2_median'`, etc.\nThe output should look something like Figure 2.\n\nFor more information about reducing image collections, see the\n[reducing section of the `ImageCollection` docs](/earth-engine/guides/ic_reducing). In\nparticular, note that images produced by reducing an `ImageCollection`\n[have no projection](/earth-engine/guides/ic_reducing#composites-have-no-projection). This means\nthat you should explicitly set the scale on any computations involving computed images\noutput by an `ImageCollection` reduction.\nFigure 2. A false color composite of the median of Landsat 5 scenes in 2008."]]