除了指定要執行縮減作業的區域,也可以指定要套用縮減器的鄰近區域。如要減少圖片鄰域,請使用 image.reduceNeighborhood()。在這種情況下,系統會在輸入圖片的滑動視窗中進行縮減,並由 ee.Kernel 指定視窗大小和形狀。reduceNeighborhood() 的輸出內容會是另一張圖片,其中每個像素值代表輸入圖片中該像素周圍鄰域的縮減輸出內容。圖 1 說明這類縮減方式。

reduceNeighborhood(),其中核心會套用縮減器。舉例來說,您可以考慮使用國家農業影像計畫 (NAIP) 圖像,量化加州紅木森林因伐木作業而產生的景觀差異。具體來說,使用鄰近區域中的標準差 (SD) 來代表記錄區域 (圖 2 中圖片的西南方) 和保護區域 (圖 2 中圖片的東北方) 之間的紋理差異。舉例來說,如要取得 NAIP 常態化差異植被指數 (NDVI) 圖像的紋理,請使用 reduceNeighborhood() 在核函式定義的鄰域中計算 SD:
程式碼編輯器 (JavaScript)
// Define a region in the redwood forest.
var redwoods = ee.Geometry.Rectangle(-124.0665, 41.0739, -123.934, 41.2029);

// Load input NAIP imagery and build a mosaic.
var naipCollection = ee.ImageCollection('USDA/NAIP/DOQQ')
  .filterBounds(redwoods)
  .filterDate('2012-01-01', '2012-12-31');
var naip = naipCollection.mosaic();

// Compute NDVI from the NAIP imagery.
var naipNDVI = naip.normalizedDifference(['N', 'R']);

// Compute standard deviation (SD) as texture of the NDVI.
var texture = naipNDVI.reduceNeighborhood({
  reducer: ee.Reducer.stdDev(),
  kernel: ee.Kernel.circle(7),
});

// Display the results.
Map.centerObject(redwoods, 12);
Map.addLayer(naip, {}, 'NAIP input imagery');
Map.addLayer(naipNDVI, {min: -1, max: 1, palette: ['FF0000', '00FF00']}, 'NDVI');
Map.addLayer(texture, {min: 0, max: 0.3}, 'SD of NDVI');
import ee
import geemap.core as geemap
Colab (Python)
# Define a region in the redwood forest.
redwoods = ee.Geometry.Rectangle(-124.0665, 41.0739, -123.934, 41.2029)

# Load input NAIP imagery and build a mosaic.
naip_collection = (
    ee.ImageCollection('USDA/NAIP/DOQQ')
    .filterBounds(redwoods)
    .filterDate('2012-01-01', '2012-12-31')
)
naip = naip_collection.mosaic()

# Compute NDVI from the NAIP imagery.
naip_ndvi = naip.normalizedDifference(['N', 'R'])

# Compute standard deviation (SD) as texture of the NDVI.
texture = naip_ndvi.reduceNeighborhood(
    reducer=ee.Reducer.stdDev(), kernel=ee.Kernel.circle(7)
)

# Display the results.
m = geemap.Map()
m.center_object(redwoods, 12)
m.add_layer(naip, {}, 'NAIP input imagery')
m.add_layer(
    naip_ndvi, {'min': -1, 'max': 1, 'palette': ['FF0000', '00FF00']}, 'NDVI'
)
m.add_layer(texture, {'min': 0, 'max': 0.3}, 'SD of NDVI')
m
計算會納入所有值不為零的核值像素。根據預設,系統會使用核心權重,但您可以使用 inputWeight 引數變更這項行為。圖 2 比較輸入圖片和 reduceNeighborhood() 輸出結果。
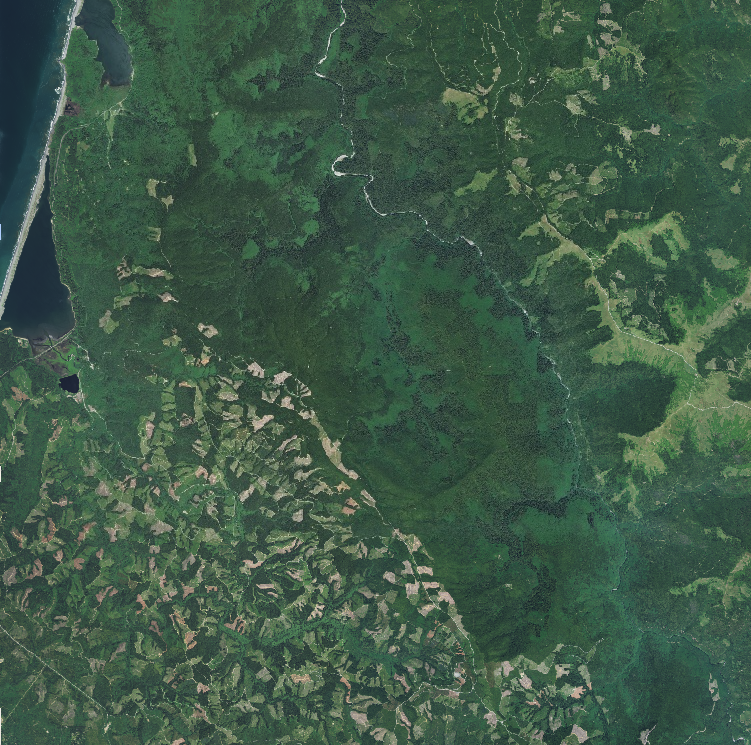
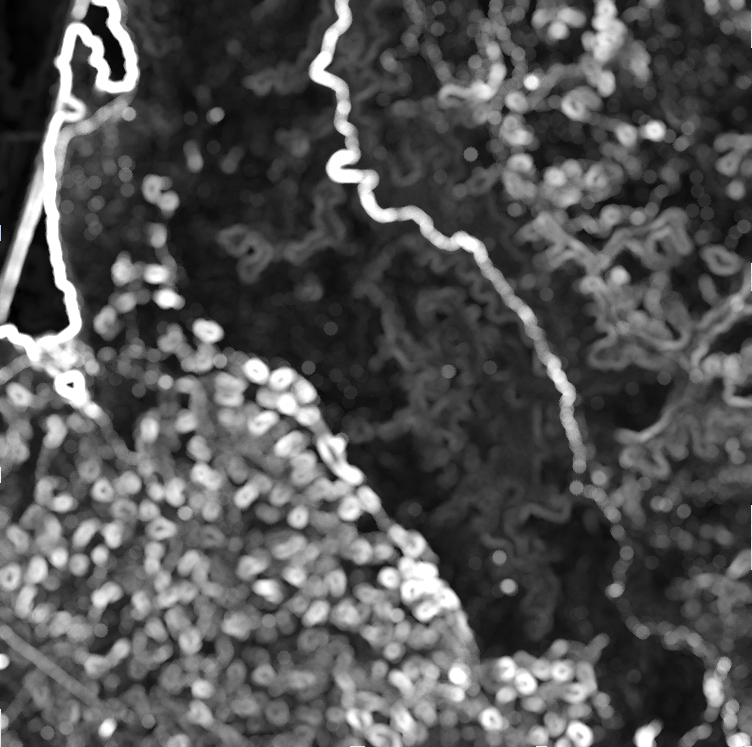
reduceNeighborhood() 使用標準偏差縮減器輸出內容。