如要將 Image (光柵) 轉換為 FeatureCollection (向量) 資料類型,請使用 image.reduceToVectors()。這是 Earth Engine 中向量化的首要機制,可用於產生區域,以便輸入其他類型的減算器。reduceToVectors() 方法會在連接像素的單一群組邊界上建立多邊形邊緣 (可選取的圓心或邊界框架)。
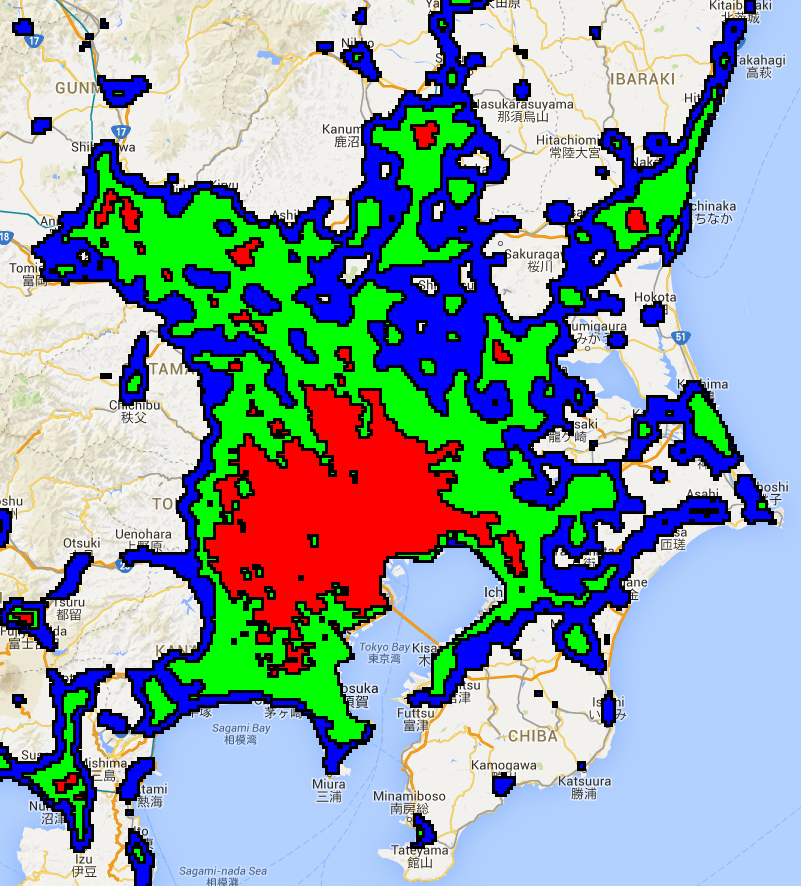
舉例來說,我們來看看 2012 年日本的夜光圖像。讓夜燈的數位編號做為開發強度的代理值。使用夜燈的任意門檻定義區域,將區域合併為單一頻帶圖像,然後使用 reduceToVectors() 將區域向量化:
程式碼編輯器 (JavaScript)
// Load a Japan boundary from the Large Scale International Boundary dataset.
var japan = ee.FeatureCollection('USDOS/LSIB_SIMPLE/2017')
  .filter(ee.Filter.eq('country_na', 'Japan'));

// Load a 2012 nightlights image, clipped to the Japan border.
var nl2012 = ee.Image('NOAA/DMSP-OLS/NIGHTTIME_LIGHTS/F182012')
  .select('stable_lights')
  .clipToCollection(japan);

// Define arbitrary thresholds on the 6-bit nightlights image.
var zones = nl2012.gt(30).add(nl2012.gt(55)).add(nl2012.gt(62));
zones = zones.updateMask(zones.neq(0));

// Convert the zones of the thresholded nightlights to vectors.
var vectors = zones.addBands(nl2012).reduceToVectors({
  geometry: japan,
  crs: nl2012.projection(),
  scale: 1000,
  geometryType: 'polygon',
  eightConnected: false,
  labelProperty: 'zone',
  reducer: ee.Reducer.mean()
});

// Display the thresholds.
Map.setCenter(139.6225, 35.712, 9);
Map.addLayer(zones, {min: 1, max: 3, palette: ['0000FF', '00FF00', 'FF0000']}, 'raster');

// Make a display image for the vectors, add it to the map.
var display = ee.Image(0).updateMask(0).paint(vectors, '000000', 3);
Map.addLayer(display, {palette: '000000'}, 'vectors');
import ee
import geemap.core as geemap
Colab (Python)
# Load a Japan boundary from the Large Scale International Boundary dataset.
japan = ee.FeatureCollection('USDOS/LSIB_SIMPLE/2017').filter(
    ee.Filter.eq('country_na', 'Japan')
)

# Load a 2012 nightlights image, clipped to the Japan border.
nl_2012 = (
    ee.Image('NOAA/DMSP-OLS/NIGHTTIME_LIGHTS/F182012')
    .select('stable_lights')
    .clipToCollection(japan)
)

# Define arbitrary thresholds on the 6-bit nightlights image.
zones = nl_2012.gt(30).add(nl_2012.gt(55)).add(nl_2012.gt(62))
zones = zones.updateMask(zones.neq(0))

# Convert the zones of the thresholded nightlights to vectors.
vectors = zones.addBands(nl_2012).reduceToVectors(
    geometry=japan,
    crs=nl_2012.projection(),
    scale=1000,
    geometryType='polygon',
    eightConnected=False,
    labelProperty='zone',
    reducer=ee.Reducer.mean(),
)

# Display the thresholds.
m = geemap.Map()
m.set_center(139.6225, 35.712, 9)
m.add_layer(
    zones,
    {'min': 1, 'max': 3, 'palette': ['0000FF', '00FF00', 'FF0000']},
    'raster',
)

# Make a display image for the vectors, add it to the map.
display_image = ee.Image(0).updateMask(0).paint(vectors, '000000', 3)
m.add_layer(display_image, {'palette': '000000'}, 'vectors')
m
請注意,輸入內容中的第一個頻帶用於識別同質區域,而剩餘的頻帶則會根據提供的縮減器進行縮減,其輸出內容會新增為結果向量屬性。geometry 參數會指定應在哪個範圍內建立向量。一般來說,建議您指定最小可用區,以便建立向量。建議您指定 scale 和 crs,以免造成混淆。輸出類型為 ‘polygon’,其中多邊形是由四個相連相鄰區域的同質區域所形成 (即 eightConnected 為 false)。最後兩個參數 labelProperty 和 reducer 分別指定輸出多邊形應分別接收區域標籤和夜燈頻帶的平均值。
繪製結果應類似圖 1 所示的東京地區。檢查輸出多邊形後,我們發現每個多邊形都有一個屬性,用於儲存區域的標籤 ({1, 2, 3}) 和夜燈頻帶的平均值,因為我們已指定平均值縮減器。