如投影文档中所述,Earth Engine 在重新投影期间默认执行最近邻重采样。您可以使用 resample() 或 reduceResolution() 方法更改此行为。具体而言,当将其中一种方法应用于输入图片时,系统将使用所指的重新采样或汇总方法执行输入的任何必要重新投影。
重采样
resample() 会导致在下次重新投影时使用指定的重采样方法('bilinear' 或 'bicubic')。由于是在输出投影中请求输入,因此在对输入执行任何其他操作之前,可能会发生隐式重新投影。因此,请直接对输入图片调用 resample()。请考虑以下简单示例:
Code Editor (JavaScript)
// Load a Landsat image over San Francisco, California, UAS.
var landsat = ee.Image('LANDSAT/LC08/C02/T1_TOA/LC08_044034_20160323');

// Set display and visualization parameters.
Map.setCenter(-122.37383, 37.6193, 15);
var visParams = {bands: ['B4', 'B3', 'B2'], max: 0.3};

// Display the Landsat image using the default nearest neighbor resampling.
// when reprojecting to Mercator for the Code Editor map.
Map.addLayer(landsat, visParams, 'original image');

// Force the next reprojection on this image to use bicubic resampling.
var resampled = landsat.resample('bicubic');

// Display the Landsat image using bicubic resampling.
Map.addLayer(resampled, visParams, 'resampled');
import ee
import geemap.core as geemap
Colab (Python)
# Load a Landsat image over San Francisco, California, UAS.
landsat = ee.Image('LANDSAT/LC08/C02/T1_TOA/LC08_044034_20160323')

# Set display and visualization parameters.
m = geemap.Map()
m.set_center(-122.37383, 37.6193, 15)
vis_params = {'bands': ['B4', 'B3', 'B2'], 'max': 0.3}

# Display the Landsat image using the default nearest neighbor resampling.
# when reprojecting to Mercator for the Code Editor map.
m.add_layer(landsat, vis_params, 'original image')

# Force the next reprojection on this image to use bicubic resampling.
resampled = landsat.resample('bicubic')

# Display the Landsat image using bicubic resampling.
m.add_layer(resampled, vis_params, 'resampled')
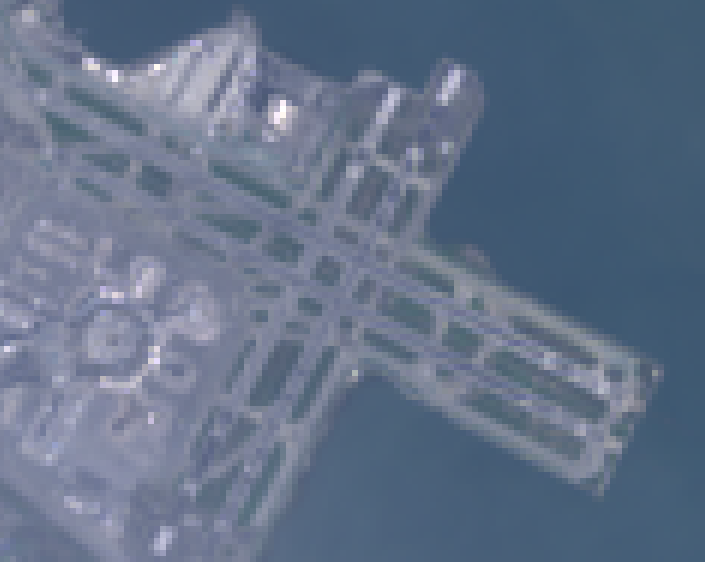
请注意,'bicubic' 重采样会导致输出像素相对于原始图片看起来更平滑(图 1)。

此代码示例的操作顺序如图 2 所示。具体而言,系统会使用输入图片上指定的重采样方法,将图像隐式重新投影到 maps Mercator 投影。
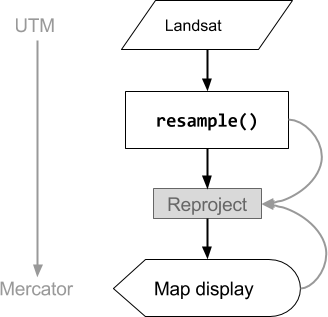
图 2. 在代码编辑器中显示之前,对输入图片调用 resample() 时操作的流程图。曲线表示信息流向重新投影:具体而言,是指要使用的输出投影、比例和重新采样方法。
降低分辨率
假设您的目标是在其他投影中将像素汇总为较大的像素,而不是在重新投影期间重新采样。在比较不同比例的图像数据集时,这非常有用,例如将基于 Landsat 的产品中的 30 米像素与基于 MODIS 的产品中的粗像素(较大比例)进行比较。您可以使用 reduceResolution() 方法控制此汇总过程。与 resample() 一样,对输入调用 reduceResolution(),以影响图片的下一次重新投影。以下示例使用 reduceResolution() 将分辨率为 30 米的森林覆盖率数据与分辨率为 500 米的植被指数进行比较:
Code Editor (JavaScript)
// Load a MODIS EVI image.
var modis = ee.Image(ee.ImageCollection('MODIS/061/MOD13A1').first())
    .select('EVI');

// Display the EVI image near La Honda, California.
Map.setCenter(-122.3616, 37.5331, 12);
Map.addLayer(modis, {min: 2000, max: 5000}, 'MODIS EVI');

// Get information about the MODIS projection.
var modisProjection = modis.projection();
print('MODIS projection:', modisProjection);

// Load and display forest cover data at 30 meters resolution.
var forest = ee.Image('UMD/hansen/global_forest_change_2023_v1_11')
    .select('treecover2000');
Map.addLayer(forest, {max: 80}, 'forest cover 30 m');

// Get the forest cover data at MODIS scale and projection.
var forestMean = forest
    // Force the next reprojection to aggregate instead of resampling.
    .reduceResolution({
      reducer: ee.Reducer.mean(),
      maxPixels: 1024
    })
    // Request the data at the scale and projection of the MODIS image.
    .reproject({
      crs: modisProjection
    });

// Display the aggregated, reprojected forest cover data.
Map.addLayer(forestMean, {max: 80}, 'forest cover at MODIS scale');
import ee
import geemap.core as geemap
Colab (Python)
# Load a MODIS EVI image.
modis = ee.Image(ee.ImageCollection('MODIS/006/MOD13A1').first()).select('EVI')

# Display the EVI image near La Honda, California.
m.set_center(-122.3616, 37.5331, 12)
m.add_layer(modis, {'min': 2000, 'max': 5000}, 'MODIS EVI')

# Get information about the MODIS projection.
modis_projection = modis.projection()
display('MODIS projection:', modis_projection)

# Load and display forest cover data at 30 meters resolution.
forest = ee.Image('UMD/hansen/global_forest_change_2015').select(
    'treecover2000'
)
m.add_layer(forest, {'max': 80}, 'forest cover 30 m')

# Get the forest cover data at MODIS scale and projection.
forest_mean = (
    forest
    # Force the next reprojection to aggregate instead of resampling.
    .reduceResolution(reducer=ee.Reducer.mean(), maxPixels=1024)
    # Request the data at the scale and projection of the MODIS image.
    .reproject(crs=modis_projection)
)

# Display the aggregated, reprojected forest cover data.
m.add_layer(forest_mean, {'max': 80}, 'forest cover at MODIS scale')
请注意,在此示例中,输出投影是使用 reproject() 明确设置的。在重新投影到 MODIS 正弦投影期间,较小的像素会使用指定的 reducer(示例中的 ee.Reducer.mean())进行汇总,而不是重新采样。此操作序列如图 3 所示。虽然此示例使用 reproject() 来帮助直观呈现 reduceResolution() 的效果,但大多数脚本都不需要显式重新投影;请参阅此处的警告。
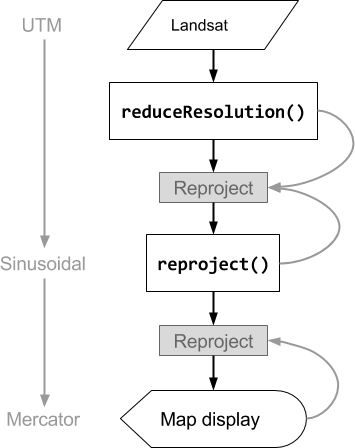
图 3. 在 reproject() 之前对输入图片调用 reduceResolution() 时的操作流程图。曲线表示信息流向重新投影:具体而言,是指要使用的输出投影、比例和像素聚合方法。
ReduceResolution 的像素粗细
reduceResolution() 聚合过程中使用的像素权重取决于要聚合的较小像素与输出投影指定的较大像素之间的重叠。如图 4 所示。
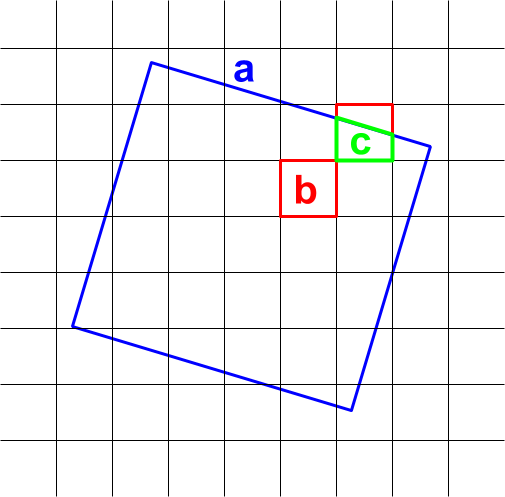
图 4. reduceResolution() 的输入像素(黑色)和输出像素(蓝色)。
默认行为是,输入像素权重计算为输入像素覆盖的输出像素区域的百分比。在该图中,输出像素的面积为 a,与交叉区域面积为 b 的输入像素的权重计算为 b/a,与交叉区域面积为 c 的输入像素的权重计算为 c/a。使用平均值归约器以外的归约器时,此行为可能会导致意外结果。例如,如需计算每个像素的森林面积,请使用平均值归约器计算像素覆盖的部分,然后乘以面积(而不是计算较小像素的面积,然后使用求和归约器对它们进行求和):
Code Editor (JavaScript)
// Compute forest area per MODIS pixel.
var forestArea = forest.gt(0)
    // Force the next reprojection to aggregate instead of resampling.
    .reduceResolution({
      reducer: ee.Reducer.mean(),
      maxPixels: 1024
    })
    // The reduce resolution returns the fraction of the MODIS pixel
    // that's covered by 30 meter forest pixels.  Convert to area
    // after the reduceResolution() call.
    .multiply(ee.Image.pixelArea())
    // Request the data at the scale and projection of the MODIS image.
    .reproject({
      crs: modisProjection
    });
Map.addLayer(forestArea, {max: 500 * 500}, 'forested area at MODIS scale');
import ee
import geemap.core as geemap
Colab (Python)
# Compute forest area per MODIS pixel.
forest_area = (
    forest.gt(0)
    # Force the next reprojection to aggregate instead of resampling.
    .reduceResolution(reducer=ee.Reducer.mean(), maxPixels=1024)
    # The reduce resolution returns the fraction of the MODIS pixel
    # that's covered by 30 meter forest pixels.  Convert to area
    # after the reduceResolution() call.
    .multiply(ee.Image.pixelArea())
    # Request the data at the scale and projection of the MODIS image.
    .reproject(crs=modis_projection)
)
m.add_layer(forest_area, {'max': 500 * 500}, 'forested area at MODIS scale')
m