

如投影文件所述,Earth Engine 在重新投影期間,預設會執行最近鄰重新取樣。您可以使用 resample() 或 reduceResolution() 方法變更這項行為。具體來說,如果將其中一種方法套用至輸入圖片,系統就會使用指定的重新取樣或匯總方法,重新投影輸入內容。
重新取樣
resample() 會在下次重新投影時,使用指定的重新取樣方法 ('bilinear' 或 'bicubic')。由於輸入內容是在輸出投影中要求,因此在對輸入內容執行任何其他作業之前,可能會發生隱含重新投影。因此,請直接在輸入圖片上呼叫 resample()。請參考以下簡單範例:
程式碼編輯器 (JavaScript)
// Load a Landsat image over San Francisco, California, UAS.
var landsat = ee.Image('LANDSAT/LC08/C02/T1_TOA/LC08_044034_20160323');

// Set display and visualization parameters.
Map.setCenter(-122.37383, 37.6193, 15);
var visParams = {bands: ['B4', 'B3', 'B2'], max: 0.3};

// Display the Landsat image using the default nearest neighbor resampling.
// when reprojecting to Mercator for the Code Editor map.
Map.addLayer(landsat, visParams, 'original image');

// Force the next reprojection on this image to use bicubic resampling.
var resampled = landsat.resample('bicubic');

// Display the Landsat image using bicubic resampling.
Map.addLayer(resampled, visParams, 'resampled');
import ee
import geemap.core as geemap
Colab (Python)
# Load a Landsat image over San Francisco, California, UAS.
landsat = ee.Image('LANDSAT/LC08/C02/T1_TOA/LC08_044034_20160323')

# Set display and visualization parameters.
m = geemap.Map()
m.set_center(-122.37383, 37.6193, 15)
vis_params = {'bands': ['B4', 'B3', 'B2'], 'max': 0.3}

# Display the Landsat image using the default nearest neighbor resampling.
# when reprojecting to Mercator for the Code Editor map.
m.add_layer(landsat, vis_params, 'original image')

# Force the next reprojection on this image to use bicubic resampling.
resampled = landsat.resample('bicubic')

# Display the Landsat image using bicubic resampling.
m.add_layer(resampled, vis_params, 'resampled')
請注意,'bicubic' 重新取樣會導致輸出像素看起來比原始圖片更平滑 (圖 1)。
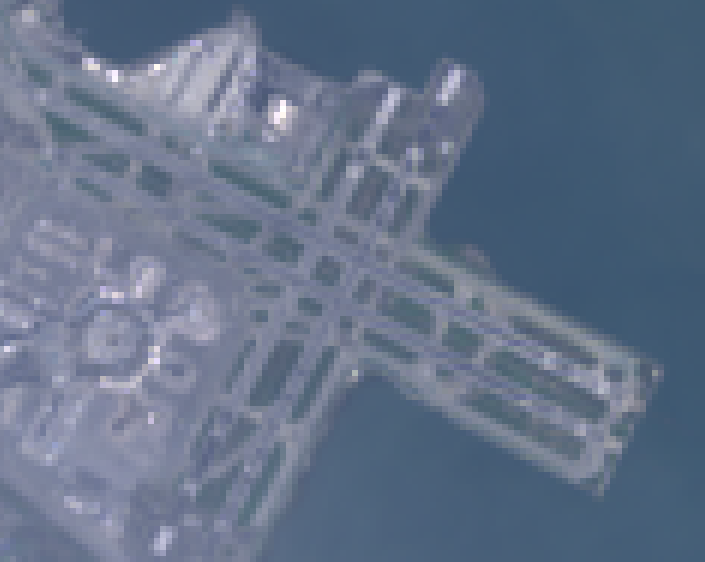
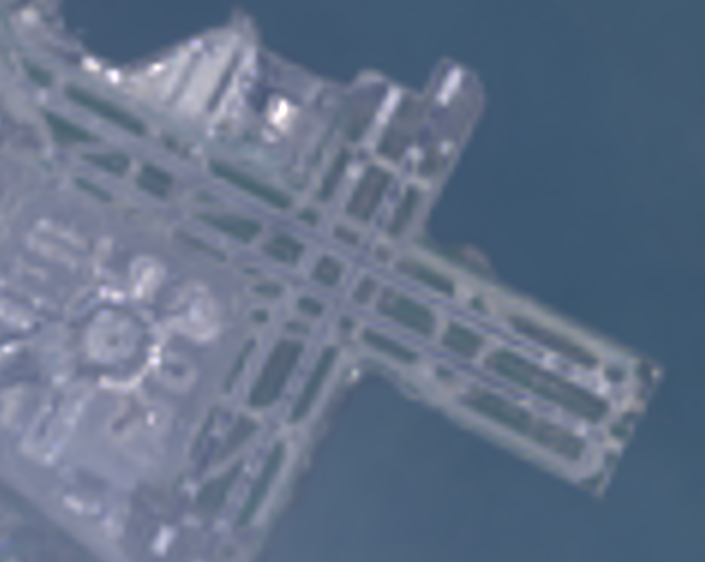
圖 2 顯示這個程式碼範例的作業順序。具體來說,系統會使用輸入圖片上指定的重新取樣方法,隱含重新投影至地圖墨卡托投影。
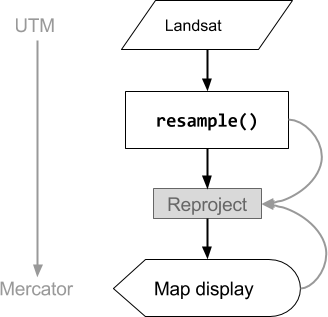
圖 2. 在程式碼編輯器中顯示輸入圖片前,對圖片呼叫 resample() 時的作業流程圖。曲線表示資訊流向重新投影:具體來說,就是輸出投影、比例和要使用的重新取樣方法。
降低解析度
假設您的目標不是在重新投影期間重新取樣,而是將像素匯總為不同投影中的較大像素。這在比較不同尺度的圖像資料集時非常實用,例如將 Landsat 產品的 30 公尺像素,與 MODIS 產品的粗像素 (較高尺度) 進行比較。您可以使用 reduceResolution() 方法控制這項匯總程序。與 resample() 相同,請在輸入內容上呼叫 reduceResolution(),以便影響圖片的下一次重新投影。以下範例使用 reduceResolution(),比較解析度為 30 公尺的森林覆蓋資料,以及解析度為 500 公尺的植被指數:
程式碼編輯器 (JavaScript)
// Load a MODIS EVI image.
var modis = ee.Image(ee.ImageCollection('MODIS/061/MOD13A1').first())
    .select('EVI');

// Display the EVI image near La Honda, California.
Map.setCenter(-122.3616, 37.5331, 12);
Map.addLayer(modis, {min: 2000, max: 5000}, 'MODIS EVI');

// Get information about the MODIS projection.
var modisProjection = modis.projection();
print('MODIS projection:', modisProjection);

// Load and display forest cover data at 30 meters resolution.
var forest = ee.Image('UMD/hansen/global_forest_change_2025_v1_13')
    .select('treecover2000');
Map.addLayer(forest, {max: 80}, 'forest cover 30 m');

// Get the forest cover data at MODIS scale and projection.
var forestMean = forest
    // Force the next reprojection to aggregate instead of resampling.
    .reduceResolution({
      reducer: ee.Reducer.mean(),
      maxPixels: 1024
    })
    // Request the data at the scale and projection of the MODIS image.
    .reproject({
      crs: modisProjection
    });

// Display the aggregated, reprojected forest cover data.
Map.addLayer(forestMean, {max: 80}, 'forest cover at MODIS scale');
import ee
import geemap.core as geemap
Colab (Python)
# Load a MODIS EVI image.
modis = ee.Image(ee.ImageCollection('MODIS/061/MOD13A1').first()).select('EVI')

# Display the EVI image near La Honda, California.
m.set_center(-122.3616, 37.5331, 12)
m.add_layer(modis, {'min': 2000, 'max': 5000}, 'MODIS EVI')

# Get information about the MODIS projection.
modis_projection = modis.projection()
display('MODIS projection:', modis_projection)

# Load and display forest cover data at 30 meters resolution.
forest = ee.Image('UMD/hansen/global_forest_change_2025_v1_13').select(
    'treecover2000'
)
m.add_layer(forest, {'max': 80}, 'forest cover 30 m')

# Get the forest cover data at MODIS scale and projection.
forest_mean = (
    forest
    # Force the next reprojection to aggregate instead of resampling.
    .reduceResolution(reducer=ee.Reducer.mean(), maxPixels=1024)
    # Request the data at the scale and projection of the MODIS image.
    .reproject(crs=modis_projection)
)

# Display the aggregated, reprojected forest cover data.
m.add_layer(forest_mean, {'max': 80}, 'forest cover at MODIS scale')
在這個範例中,請注意輸出投影是使用 reproject() 明確設定。在重新投影至 MODIS 正弦投影期間,系統會使用指定的縮減器 (範例中的 ee.Reducer.mean()) 匯總較小的像素,而非重新取樣。圖 3 說明瞭這項作業序列。雖然這個範例使用 reproject() 協助呈現 reduceResolution() 的效果,但大多數指令碼不需要明確重新投影;請參閱「重新投影」一節中的警告。
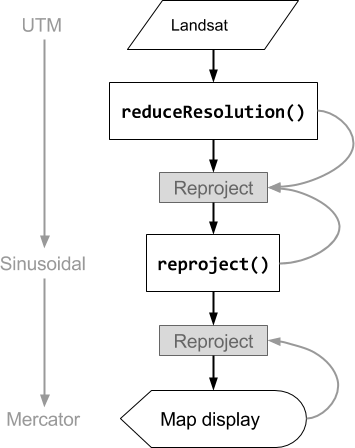
圖 3. 在 reproject() 之前對輸入圖片呼叫 reduceResolution() 時的作業流程圖。曲線表示資訊流向重新投影:具體來說,就是輸出投影、比例和像素匯總方法。
ReduceResolution的像素權重
reduceResolution() 匯總程序中使用的像素權重,取決於要匯總的小像素與輸出投影指定的大像素之間的重疊程度。如圖 4 所示。

圖 4. reduceResolution() 的輸入像素 (黑色) 和輸出像素 (藍色)。
預設行為是將輸入像素權重,計算為輸入像素涵蓋的輸出像素區域比例。在圖表中,輸出像素的面積為 a,交集面積為 b 的輸入像素權重計算為 b/a,交集面積為 c 的輸入像素權重計算為 c/a。使用平均值縮減器以外的縮減器時,這種行為可能會導致非預期的結果。舉例來說,如要計算每個像素的森林面積,請使用平均值縮減器計算像素覆蓋的比例,然後乘以面積 (而非計算較小像素的面積,然後使用總和縮減器加總):
程式碼編輯器 (JavaScript)
// Compute forest area per MODIS pixel.
var forestArea = forest.gt(0)
    // Force the next reprojection to aggregate instead of resampling.
    .reduceResolution({
      reducer: ee.Reducer.mean(),
      maxPixels: 1024
    })
    // The reduce resolution returns the fraction of the MODIS pixel
    // that's covered by 30 meter forest pixels.  Convert to area
    // after the reduceResolution() call.
    .multiply(ee.Image.pixelArea())
    // Request the data at the scale and projection of the MODIS image.
    .reproject({
      crs: modisProjection
    });
Map.addLayer(forestArea, {max: 500 * 500}, 'forested area at MODIS scale');
import ee
import geemap.core as geemap
Colab (Python)
# Compute forest area per MODIS pixel.
forest_area = (
    forest.gt(0)
    # Force the next reprojection to aggregate instead of resampling.
    .reduceResolution(reducer=ee.Reducer.mean(), maxPixels=1024)
    # The reduce resolution returns the fraction of the MODIS pixel
    # that's covered by 30 meter forest pixels.  Convert to area
    # after the reduceResolution() call.
    .multiply(ee.Image.pixelArea())
    # Request the data at the scale and projection of the MODIS image.
    .reproject(crs=modis_projection)
)
m.add_layer(forest_area, {'max': 500 * 500}, 'forested area at MODIS scale')
m