您可以使用各种 widget 构建界面。这些 widget 包括按钮、复选框、滑块、文本框和选择菜单。微件只能打印或添加到面板一次。以下部分介绍了这些 widget 的基本功能、外观和风格。如需详细了解如何设置微件的样式,请参阅“样式”部分。以下示例只是将 widget print() 到控制台。如需详细了解如何将微件添加到面板,请参阅“面板和布局”页面。
ui.Label
标签只是显示文本的区域。例如,以下代码会输出标签:
Code Editor (JavaScript)
var label = ui.Label('Cool label!');
print(label);
该代码应如下所示:
通过插入新行字符 (\n) 并将 whiteSpace 样式属性参数设置为 'pre',将长标签拆分为多个标签:
print(ui.Label('Here is a:\nnew line', {whiteSpace: 'pre'}));
ui.Button
按钮是一种可点击的交互式界面 widget。您可以指定要在用户点击按钮时调用的函数(“回调”函数)。(如需详细了解如何使用回调函数处理事件,请参阅“事件”页面)。 以下示例会在用户点击按钮时输出地图的当前中心:
Code Editor (JavaScript)
var button = ui.Button({
  label: 'Get Map Center',
  onClick: function() {
    print(Map.getCenter());
  }
});
print(button);
该代码应如下所示:

ui.Checkbox
复选框是一种微件,可让用户勾选(或取消勾选)复选框。当复选框的状态发生变化时,系统会向注册到该 widget 的回调传递一个布尔值,指示复选框当前是否处于选中状态。例如:
Code Editor (JavaScript)
var checkbox = ui.Checkbox('Show SRTM layer', true);

checkbox.onChange(function(checked) {
  // Shows or hides the first map layer based on the checkbox's value.
  Map.layers().get(0).setShown(checked);
});

Map.addLayer(ee.Image('CGIAR/SRTM90_V4'));
print(checkbox);
打印的复选框应如下所示:

请注意,选中此复选框会开启在地图上显示的图层。与其他界面组件一样,您可以通过编程方式操控代码编辑器的 Map。如需详细了解 Map 对象,请参阅“面板和布局”页面。
ui.Slider
滑块是一种微件,可让用户调整滑块以获取滑块范围内的数字。您可以使用构造函数或通过设置滑块的属性来配置范围。以下示例使用滑块设置地图上第一层的不透明度:
Code Editor (JavaScript)
var slider = ui.Slider();

slider.setValue(0.9);  // Set a default value.
slider.onChange(function(value) {
  Map.layers().get(0).setOpacity(value);
});

Map.addLayer(ee.Image(255), {palette: 'blue'});
print(slider);
滑块应如下所示:

请注意,滑块值显示在滑块右侧。
ui.DateSlider
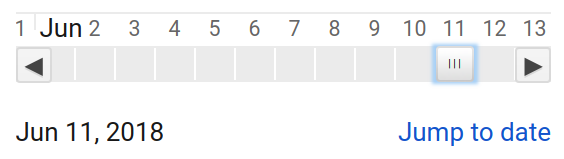
DateSlider widget 与 Slider widget 类似,但会显式处理日期。配置为选择 2018 年 6 月的某一天的 DateSlider 如下所示:
DateSlider 非常适合过滤集合,如以下示例所示,该示例会根据 DateSlider 中设置的 DateRange 构建年度复合报告:
Code Editor (JavaScript)
// Use a DateSlider to create annual composites of this collection.
var collection = ee.ImageCollection('LANDSAT/LC08/C02/T1');
// Use the start of the collection and now to bound the slider.
var start = ee.Image(collection.first()).date().get('year').format();
var now = Date.now();
var end = ee.Date(now).format();

// Run this function on a change of the dateSlider.
var showMosaic = function(range) {
  var mosaic = ee.Algorithms.Landsat.simpleComposite({
    collection: collection.filterDate(range.start(), range.end())
  });
  // Asynchronously compute the name of the composite.  Display it.
  range.start().get('year').evaluate(function(name) {
    var visParams = {bands: ['B4', 'B3', 'B2'], max: 100};
    var layer = ui.Map.Layer(mosaic, visParams, name + ' composite');
    Map.layers().set(0, layer);
  });
};

// Asynchronously compute the date range and show the slider.
var dateRange = ee.DateRange(start, end).evaluate(function(range) {
  var dateSlider = ui.DateSlider({
    start: range['dates'][0],
    end: range['dates'][1],
    value: null,
    period: 365,
    onChange: showMosaic,
    style: {width: '180px'}
  });
  Map.add(dateSlider.setValue(now));
});

// Initialize the map location at southern Africa.
Map.setCenter(23.861, -27.144, 6);
ui.Textbox
文本框用于收集用户输入的文本。例如:
Code Editor (JavaScript)
var textbox = ui.Textbox({
  placeholder: 'Enter text here...',
  onChange: function(text) {
    print('So what you are saying is ' + text + '?');
  }
});
print(textbox);
文本框应如下所示:

请注意,只有在用户输入完文本(并按下 Return 键)或点击离开文本框时,回调才会触发。
ui.Select
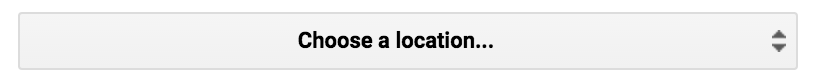
选择微件表示一个下拉菜单,其中包含用户可以选择的选项。以下示例展示了一个下拉菜单,供用户选择位置:
Code Editor (JavaScript)
var places = {
  MTV: [-122.0849, 37.3887],
  PEK: [116.4056, 39.9097],
  ZRH: [8.536, 47.376]
};

var select = ui.Select({
  items: Object.keys(places),
  onChange: function(key) {
    Map.setCenter(places[key][0], places[key][1]);
  }
});

// Set a place holder.
select.setPlaceholder('Choose a location...');

print(select);
选择 widget 应如下所示:
ui.Chart
ui.Chart 软件包中的图表的行为方式与 Chart 软件包中的图表类似。具体而言,ui.Chart 是 Google Visualization API 的 ChartWrapper 实例周围的一层薄壳。
如需详细了解如何操控 ChartWrapper 对象,请参阅此参考文档。如需详细了解 Earth Engine 中的图表辅助函数,请参阅图表文档。
ui.Thumbnail
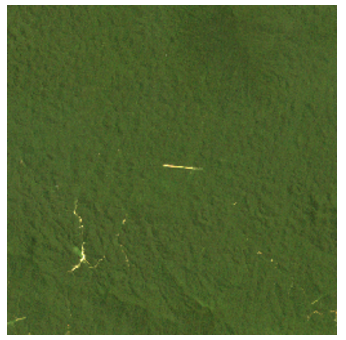
缩略图 widget 可用于预览 ee.Image 和 ee.ImageCollection 对象。当提供 ee.Image 时,该 widget 会显示静态图片;当提供 ee.ImageCollection 时,它会显示动画,其中每个输入图片对应一个帧。与 ee.Image.getThumbURL() 和 ee.ImageCollection.getVideoThumbURL() 一样,您可以指定参数来控制生成的缩略图的格式和尺寸:
Code Editor (JavaScript)
// Create a box around an area in the Brazilian Amazon.
var box = ee.Geometry.Polygon([[
  [-62.9564, 2.5596], [-62.9550, 2.4313], [-62.8294, 2.4327], [-62.8294, 2.5596]
]]);

// Visualize the image in RGB.
var image = ee.Image('LANDSAT/LE07/C02/T1_L2/LE07_233058_20011113')
                .select(['SR_B[1-3]'])  // blue, green, red reflectance
                .multiply(0.0000275).add(-0.2)  // apply scaling factors
                .visualize({
                  bands: ['SR_B3', 'SR_B2', 'SR_B1'],
                  min: 0,
                  max: 0.12,
                  gamma: 1.3
                });

// Print a thumbnail to the console.
print(ui.Thumbnail({
  image: image,
  params: {dimensions: '256x256', region: box, format: 'png'},
  style: {height: '300px', width: '300px'}
}));
缩略图应如下所示:
ui.Map
ui.Map 是一个地图微件。(事实上,默认的代码编辑器 Map 就是此类的实例)。与其他 widget 一样,您可以将地图输出到控制台。通过清除、获取或设置各个图层来操控地图内容。以下示例会将一个地图输出到控制台,该地图显示了代码编辑器 Map 的边界:
Code Editor (JavaScript)
// Make a little map.
var map = ui.Map();

// Make the little map display an inset of the big map.
var createInset = function() {
  var bounds = ee.Geometry.Rectangle(Map.getBounds());
  map.centerObject(bounds);
  map.clear();
  map.addLayer(bounds);
};

// Run it once to initialize.
createInset();

// Get a new inset map whenever you click on the big map.
Map.onClick(createInset);

// Display the inset map in the console.
print(map);
插入地图应如下所示:
在此示例中,用户需要点击大地图,才能在小地图中绘制内嵌地图。
您还可以通过对地图实例调用 layers() 来操控地图上的图层。layers() 会返回一个 ui.data.ActiveList,即一个类似数组的对象。更改此值后,地图上的图层也会随之更改。如需了解详情,请参阅 ui.Map.Layer 部分。
ui.Map.Layer
层不是可设置样式的微件,例如 ui.Button。它只是地图上图层的数据表示形式。以下示例演示了如何通过创建图层并根据用户输入更新图层的属性来更新地图:
Code Editor (JavaScript)
var consoleMap = ui.Map({
  lon: -2.0174,
  lat: 48.6474,
  zoom: 13
});

// Create a Layer from this Sentinel-2 image
var image = ee.Image('COPERNICUS/S2/20150821T111616_20160314T094808_T30UWU');
var visParams = {bands: ['B4', 'B3', 'B2'], max: 2048, gamma: 1};
var layer = ui.Map.Layer(image, visParams);

// Update the map by updating the layers list.
var layers = consoleMap.layers();
layers.add(layer);

// Make a textbox to accept a gamma value.
// Update the layer when the gamma value is entered.
var gammaBox = ui.Textbox({
  value: 1,
  onChange: function(value) {
    // visParams is NOT an ActiveDictionary, so set it again.
    visParams.gamma = value;
    layer.setVisParams(visParams);
  }
});

print(ui.Label('Enter a gamma value:'));
print(gammaBox);
print(consoleMap);
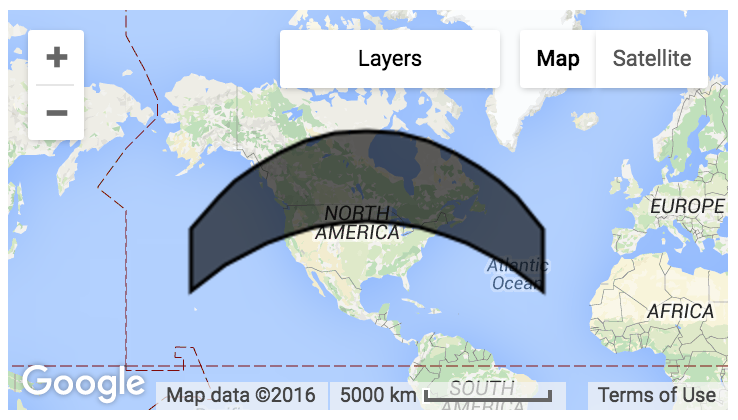
ui.Map.CloudStorageLayer
如果您想要显示计算成本相对较高的图层(例如在应用中),出于性能方面的原因,您可能需要将数据导出到 Cloud Storage 存储分区。这些仅用于可视化的静态图层可以提高应用和脚本的响应速度。为此,您可以使用 Export.map.toCloudStorage() 创建静态显示层。
如需使用之前由 Export.map.toCloudStorage() 导出的图块集,请根据指定的 Cloud Storage 存储分区和路径构建新的 ui.Map.Layer:
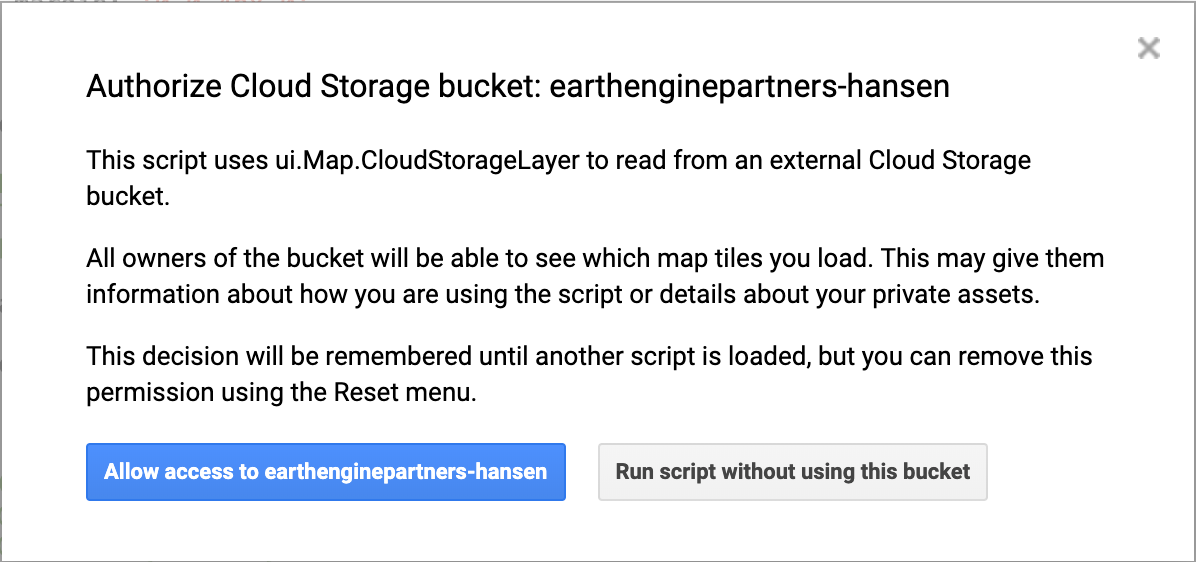
Map.add(ui.Map.CloudStorageLayer({
  bucket: 'earthenginepartners-hansen',
  path: 'tiles/gfc_v1.4/loss_year',
  maxZoom: 12,
  suffix: '.png'
}));
运行用于加载 Cloud Storage 图层的脚本时,您可能会看到以下警告消息:
ui.Map.DrawingTools
系统会默认向代码编辑器中的 Map 添加一组几何图形绘制工具。您可以通过调用 Map.drawingTools() 来更改默认 Map 中这些工具的行为。例如,如需隐藏绘图工具,请使用以下代码:
Code Editor (JavaScript)
Map.drawingTools().setShown(false);
默认情况下,新创建的地图不会获得绘图工具,但您可以通过对地图调用 drawingTools() 方法来启用绘图工具:
Code Editor (JavaScript)
var map = ui.Map();
// Prints true since drawingTools() adds drawing tools to the map.
print(map.drawingTools().getShown());
// Replace the default Map with the newly created map.
ui.root.widgets().reset([map]);
绘制工具绘制的几何图形图层会放入 ui.data.ActiveList,您可以通过调用 Map.drawingTools().layers() 来访问该图层。几何图形图层列表会像其他活动列表一样响应事件,例如 Map.layers() 返回的 Map 上的图层列表。以下示例展示了如何设置工具绘制的几何图层的可见性(默认情况下会显示):
Code Editor (JavaScript)
Map.drawingTools().layers().forEach(function(layer) {
  layer.setShown(false);
});
如需以编程方式将图层添加到绘图工具,您可以对绘图工具调用 addLayer 方法,也可以直接将图层添加到图层列表:
Code Editor (JavaScript)
var geometries = [ee.Geometry.Point([0,0]), ee.Geometry.Rectangle([[0,0], [1,1]])];
Map.drawingTools().addLayer(geometries, 'my_geometry1', 'red');

var layer = ui.Map.GeometryLayer(geometries, 'my_geometry2', 'blue');
Map.drawingTools().layers().add(layer);
发布应用时,绘图工具的状态也会保留下来。如果您显示或隐藏了绘图工具,它们也会在应用中显示或隐藏。导入内容中的几何图形也会保留下来。
ui.Map.GeometryLayer
GeometryLayer 是一组几何图形,可用作单个 Geometry、GeometryCollection 或 FeatureCollection,添加到脚本顶部的“导入”部分,并可在代码中引用。
绘图工具绘制的 GeometryLayer 具有默认行为,您可以通过提供新的回调函数来替换该行为。例如,假设您希望对几何图形进行互动性更改以触发事件。如需实现特定行为,您可以在工具上设置 onEdit()、onErase() 或 onDraw() 方法,以响应用户操作。
以下示例展示了如何在用户添加/修改/擦除几何图形时触发计算并使用计算结果更新标签:
Code Editor (JavaScript)
// Load elevation data.
var srtm = ee.Image('USGS/SRTMGL1_003');
Map.addLayer(srtm, {min: 0, max: 5000}, 'SRTM');

// Make a label to display mean elevation at drawn points.
var label = new ui.Label('Draw points to calculate mean elevation');
var inspector = new ui.Panel([label]);
Map.add(inspector);
// Don't make imports that correspond to the drawn points.
Map.drawingTools().setLinked(false);
// Limit the draw modes to points.
Map.drawingTools().setDrawModes(['point']);
// Add an empty layer to hold the drawn points.
Map.drawingTools().addLayer([]);
// Set the geometry type to be point.
Map.drawingTools().setShape('point');
// Enter drawing mode.
Map.drawingTools().draw();

// This function gets called when the geometry layer changes.
// Use debounce to call the function at most every 100 milliseconds.
var getAverageElevation = ui.util.debounce(function() {
  var points = Map.drawingTools().layers().get(0).toGeometry();
  var elevation = srtm.reduceRegion({
    reducer: ee.Reducer.mean(),
    geometry: points,
    scale: 30
  }).get('elevation');
  // Asynchronously evaluate the mean elevation.
  elevation.evaluate(showElevation);
}, 100);

// Set the callback function on changes of the geometry layer.
Map.drawingTools().onEdit(getAverageElevation);
Map.drawingTools().onDraw(getAverageElevation);
Map.drawingTools().onErase(getAverageElevation);

// Set the label to the result of the mean reduction.
function showElevation(elevation) {
  inspector.clear();
  var elevationLabel = ui.Label('Mean elevation: ' + elevation);
  inspector.add(elevationLabel);
}
请注意,setLinked() 用于切换几何图形绘制工具与代码编辑器的导入部分之间的连接。在此示例中,几何图形工具已解除关联,以防止创建导入项。toGeometry 用于将图层转换为 ee.Geometry。如果导入的图层表示 Feature 或 FeatureCollection,您可以使用 getEeObject() 检索底层 EE 对象。另请注意,使用 ui.util.debounce 可防止几何图形的每次移动都触发回调函数。具体而言,函数将在距离上次事件经过 100 毫秒后才会触发。这有助于确保仅在用户完成修改操作时运行该函数。
导入内容中的几何图形图层与 Geometry 或 GeometryCollection 相关联,因此只能包含具有相同测地线状态的几何图形,因为 GeoJSON 格式仅允许几何图形集合具有单个测地线状态(如需了解详情,请参阅“测地线几何图形与平面几何图形”页面)。通过按图层名称旁边的齿轮图标将几何图层转换为 FeatureCollection,您可以将测地线几何图形和平面几何图形添加到同一图层。但是,将其转换回 Geometry 会产生错误。为避免这种情况,请转换为 FeatureCollection 或删除几何图形,直到图层中只有一个地面曲线状态。
ui.Map.Linker
与层一样,链接器不是可设置样式的 widget。这是一个后台实用程序,可用于同步多个 ui.Map 实例的移动:
Code Editor (JavaScript)
// Add two maps to the screen.
var left = ui.Map();
var right = ui.Map();
ui.root.clear();
ui.root.add(left);
ui.root.add(right);

// Link the "change-bounds" event for the maps.
// When the user drags one map, the other will be moved in sync.
ui.Map.Linker([left, right], 'change-bounds');
ui.SplitPanel
ui.SplitPanel 非常适合并排比较内容。与两个普通面板相比,ui.SplitPanel 的优势在于,您可以使用手柄在 ui.SplitPanel 中的面板之间实现擦除过渡。以下示例使用 ui.SplitPanel 显示烧伤疤痕的光谱差异:
Code Editor (JavaScript)
// Load an image of the Santa Rosa, California 2017 fires.
var image = ee.Image('LANDSAT/LC08/C02/T1_TOA/LC08_045033_20171011');

// Add a color-SWIR composite to the default Map.
Map.setCenter(-122.6624, 38.5011, 12);
Map.addLayer(image, {bands: ['B7', 'B5', 'B3'], max: 0.3}, 'color-SWIR');

// Make another map and add a color-NIR composite to it.
var linkedMap = ui.Map();
linkedMap.addLayer(image, {bands: ['B5', 'B4', 'B3'], max: 0.3}, 'color-NIR');
// Add a thermal image to the map.
linkedMap.addLayer(image, {
  bands: ['B11'],
  min: 290,
  max: 305,
  palette: ['gray', 'white', 'yellow', 'red']
}, 'Thermal');

// Link the default Map to the other map.
var linker = ui.Map.Linker([ui.root.widgets().get(0), linkedMap]);

// Make an inset map and add it to the linked map.
var inset = ui.Map();
inset.style().set({position: 'bottom-right', width: '300px', height: '250px'});
inset.setControlVisibility({all: false, mapTypeControl: true});
linkedMap.add(inset);

// Register a function to the linked map to update the inset map.
linkedMap.onChangeBounds(function() {
  var bounds = ee.Geometry.Rectangle(Map.getBounds());
  inset.centerObject(bounds);
  inset.layers().set(0, bounds);
});

// Create a SplitPanel which holds the linked maps side-by-side.
var splitPanel = ui.SplitPanel({
  firstPanel: linker.get(0),
  secondPanel: linker.get(1),
  orientation: 'horizontal',
  wipe: true,
  style: {stretch: 'both'}
});

// Set the SplitPanel as the only thing in root.
ui.root.widgets().reset([splitPanel]);
请注意,ui.SplitPanel 构造函数中的 wipe 参数设置为 true,以便用户在两个可视化图表之间来回滑动手柄。
设置 widget 样式
微件的样式由微件的样式属性字典控制。您可以通过对该 widget 调用 style() 来访问该字典。style() 返回的对象是 ui.data.ActiveDictionary 的实例。也就是说,设置样式字典的属性会自动更新 widget 的显示方式。如需详细了解每个 widget 的样式字典的允许键,请参阅 widget 的 style() 调用的参考文档。
您可以通过调用构造函数、调用 style().set() 或使用字典参数调用 style() 来设置 widget 的样式。例如:
Code Editor (JavaScript)
var redLabel = ui.Label('Big, Red Label');

redLabel.style().set('color', 'red');
redLabel.style().set('fontWeight', 'bold');
redLabel.style().set({
  fontSize: '32px',
  padding: '10px'
});

print(redLabel);
请注意,在此示例中,首先使用键和值参数调用 style().set() 来设置标签的样式,然后使用字典参数调用 style().set()。第二次调用不会替换第一次调用;它会添加和替换各个样式属性,而不是替换整个样式字典。
如需详细了解微件的样式选项,请参阅此层叠样式表 (CSS) 参考文档,了解 style() 文档中针对每个微件列出的样式。请注意,Earth Engine 微件允许的样式在多个方面与 CSS 样式不同,尤其是 font-style 和 font-weight 分别使用 fontSize 和 fontWeight。
样式字典还包含用于控制微件位置的键。如需详细了解如何使用位置属性,请参阅“面板和布局”页面。