تابع ui.Chart نمودارها را از شیء JSON سمت کارخواه که از همان ساختار کلاس
DataTable
«نمودارهای Google» پیروی میکند، اما فاقد روشهای DataTable و تغییرپذیری است، ارائه میکند. این درواقع جدولی ۲بعدی با ردیفهایی است که مشاهدات را نشان میدهد و ستونهایی که ویژگیهای مشاهدات را نشان میدهد. این کلاس یک میانای پایه و انعطافپذیر برای نمودارسازی در
Earth Engine ارائه میدهد. این گزینه زمانی مناسب است که سطح بالایی از سفارشیسازی نمودار لازم باشد.
طرحواره DataTable
دو روش برای تعریف DataTable کاذب در Earth Engine وجود دارد: آرایه دوبعدی جاوا اسکریپت و شیء تحتاللفظی جاوا اسکریپت. برای اکثر برنامهها، ساختن یک
آرایه ۲ بعدی سادهترین رویکرد خواهد بود. در هر دو مورد، جدولی که به
ui.Chart ارسال میشود باید شیء سمت کارخواه باشد. جدولی که بهصورت دستی کدگذاری شده است، ذاتاً سمت کارخواه خواهد بود، درحالیکه شیء محاسبهشده باید بااستفاده از evaluate به سمت کارخواه منتقل شود. برای اطلاعات بیشتر درباره تفاوت بین اشیاء سمت سرور و سمت کارخواه، لطفاً به صفحه کارخواه درمقابل سرور مراجعه کنید.
آرایه جاوا اسکریپت
DataTable دوبعدی از آرایهای از ردیفها و ستونها تشکیل شده است. ردیفها مشاهدات و ستونها مشخصهها هستند. ستون اول مقادیر محور x را تعریف میکند، درحالیکه ستونهای دیگر مقادیر مجموعه محور y را تعریف میکنند. انتظار میرود ردیف اول
سرصفحه ستون باشد. سادهترین سرصفحه مجموعهای از برچسبهای ستون است که در آرایه DataTable زیر نشان داده شده است و جمعیت را براساس ایالتهای انتخابشده مرتبط میکند.
var dataTable = [
  ['State', 'Population'],
  ['CA', 37253956],
  ['NY', 19378102],
  ['IL', 12830632],
  ['MI', 9883640],
  ['OR', 3831074],
];
درصورت تمایل، ستونها را میتوان برای نقشی غیراز تعریف دامنه (محور x) و دادهها (سری محور y) تعیین کرد، مثلاً حاشیهنویسی، فاصلهها، نکتهابزارها، یا سبک. در مثال زیر، آرایه سرصفحه بهصورت مجموعهای از اشیاء ارائه شده است که نقش هر ستون بهطور صریح تعریف شده است. نقشهای قابلقبول ستون برای هر نوع «نمودار Google» را میتوانید در اسناد مربوطه آنها پیدا کنید، مثلاً قالب داده نمودار ستونی.
var dataTable = [
  [{role: 'domain'}, {role: 'data'}, {role: 'annotation'}],
  ['CA', 37253956, '37.2e6'],
  ['NY', 19378102, '19.3e6'],
  ['IL', 12830632, '12.8e6'],
  ['MI', 9883640, '9.8e6'],
  ['OR', 3831074, '3.8e6'],
];
خصوصیات ستون بهصورت زیر مشخص میشود:
| پارامتر | نوع | تعریف |
|---|---|---|
type |
رشته، توصیهشده | نوع داده ستون: 'string'، 'number'، 'boolean'، 'date'، 'datetime'، یا 'timeofday'. |
label |
رشته، توصیهشده | برچسبی برای ستون، برچسب سری در راهنمای نمودار. |
role |
رشته، توصیهشده | نقشی برای ستون (مثلاً، نقشهای نمودار ستونی). |
pattern |
رشته، اختیاری | رشته قالب عدد (یا تاریخ) که نحوه نمایش مقدار ستون را مشخص میکند. |
شیء جاوا اسکریپت
DataTable را میتوان بهعنوان شیء تحتاللفظی جاوا اسکریپت قالببندی کرد که در آن آرایههای
اشیاء ردیف و ستون ارائه شده است. برای دستورالعملهای مربوط به مشخص کردن پارامترهای ستون و ردیف، این
راهنما
را ببینید.
var dataTable = {
  cols: [{id: 'name', label: 'State', type: 'string'},
         {id: 'pop', label: 'Population', type: 'number'}],
  rows: [{c: [{v: 'CA'}, {v: 37253956}]},
         {c: [{v: 'NY'}, {v: 19378102}]},
         {c: [{v: 'IL'}, {v: 12830632}]},
         {c: [{v: 'MI'}, {v: 9883640}]},
         {c: [{v: 'OR'}, {v: 3831074}]}]
};
نمودار DataTable دستی
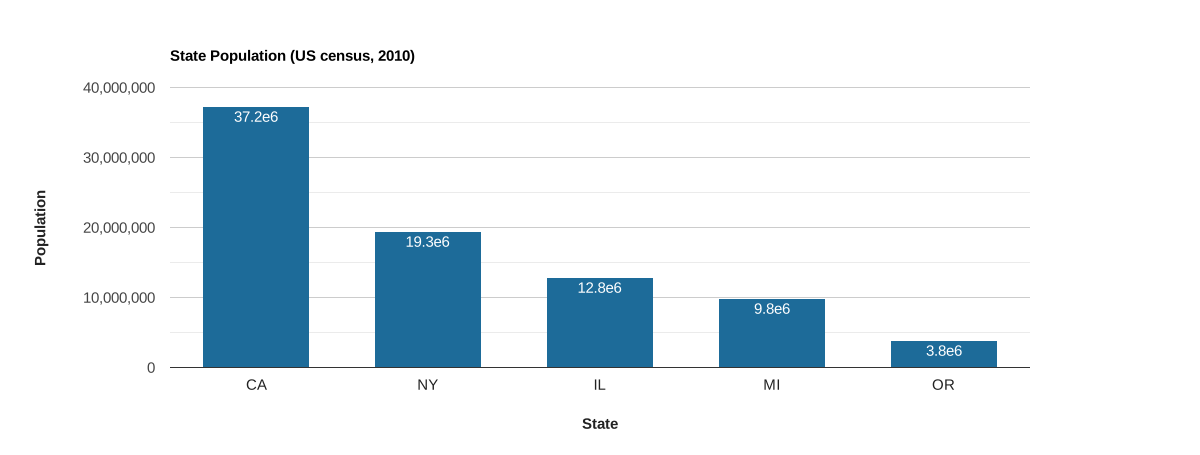
فرض کنید مقدار کمی داده ثابت دارید که میخواهید در نمودار نمایش دهید.
از مشخصات آرایه یا شیء جاوا اسکریپت برای ساختن ورودیای که به تابع ui.Chart ارسال میشود استفاده کنید. در اینجا، جمعیت ایالتهای انتخابشده از سرشماری ۲۰۱۰ ایالات متحده بهصورت آرایه جاوا اسکریپت با اشیاء سرصفحه ستون که ویژگیهای ستون را تعریف میکنند کدگذاری شده است. توجه داشته باشید که ستون سوم به نقش
'annotation' اختصاص داده شده است، که جمعیت را بهعنوان حاشیهنویسی به هر مشاهده
در نمودار اضافه میکند.
ویرایشگر کد (جاوا اسکریپت)
// Define a DataTable using a JavaScript array with a column property header.
var dataTable = [
  [
    {label: 'State', role: 'domain', type: 'string'},
    {label: 'Population', role: 'data', type: 'number'},
    {label: 'Pop. annotation', role: 'annotation', type: 'string'}
  ],
  ['CA', 37253956, '37.2e6'],
  ['NY', 19378102, '19.3e6'],
  ['IL', 12830632, '12.8e6'],
  ['MI', 9883640, '9.8e6'],
  ['OR', 3831074, '3.8e6']
];

// Define the chart and print it to the console.
var chart = ui.Chart(dataTable).setChartType('ColumnChart').setOptions({
  title: 'State Population (US census, 2010)',
  legend: {position: 'none'},
  hAxis: {title: 'State', titleTextStyle: {italic: false, bold: true}},
  vAxis: {title: 'Population', titleTextStyle: {italic: false, bold: true}},
  colors: ['1d6b99']
});
print(chart);
نمودار DataTable محاسبهشده
آرایه DataTable را میتوان از ee.List دوبعدی ایجاد کرد که از سرور
به کارخواه ازطریق evaluate ارسال شده است. یک سناریوی رایج تبدیل ویژگیهای یک
ee.FeatureCollection، ee.ImageCollection، یا کاهش عنصر-عاقلانه از
اینها به یک DataTable است. استراتژی اعمالشده در مثالهای زیر، تابعی را روی ee.ImageCollection نگاشت میکند که عنصر دادهشده را کاهش میدهد، ee.List را از نتایج کاهش جمعآوری میکند، و فهرست را بهعنوان ویژگیای بهنام 'row' به عنصر برگرداندهشده پیوست میکند. هر عنصر از مجموعه جدید دارای یک ee.List یکبعدی است که نشاندهنده یک ردیف در DataTable است.
از تابع aggregate_array() برای جمعآوری همه ویژگیهای 'row' در یک ee.List والد استفاده میشود تا یک ee.List دوبعدی سمت سرور به شکل موردنیاز برای DataTable ایجاد شود. سرصفحه ستون سفارشی به جدول الحاق میشود و نتیجه با evaluate به سمت کارخواه منتقل میشود، جایی که بااستفاده از تابع ui.Chart رندر میشود.
سری زمانی براساس منطقه
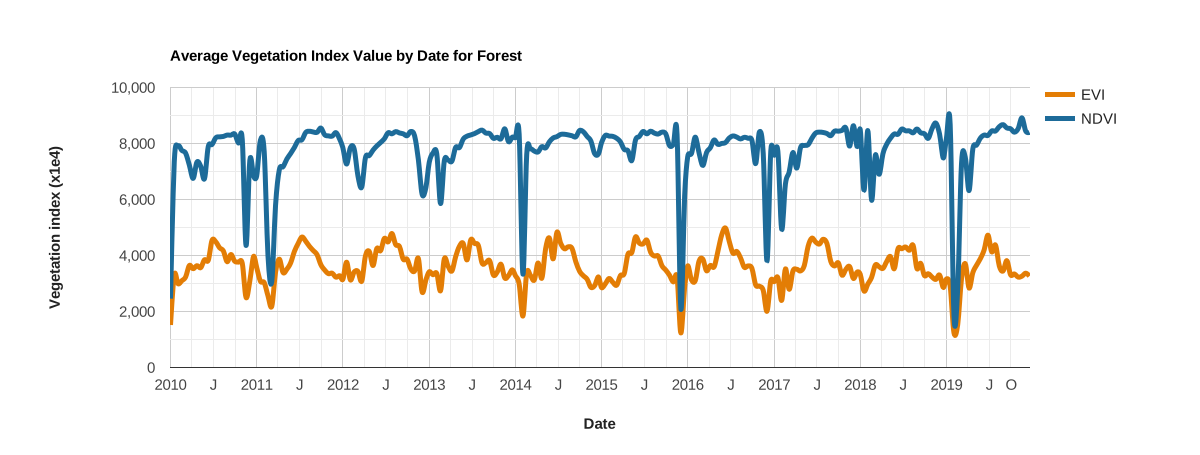
این مثال سری زمانی شاخصهای پوشش گیاهی NDVI و EVI مشتقشده از MODIS را برای یک بومناحیه جنگلی نشان میدهد. هر تصویر در سری توسط بومناحیه کاهش مییابد و نتایج آن بهعنوان ویژگی 'row' جمعآوری میشود که در DataTable برای ارسال به کارخواه و نمودارسازی با ui.Chart تجمیع میشود. توجه داشته باشید که این قطعه کد همان نموداری را تولید میکند که توسط نمونه نمودار ui.Chart.image.series تولید شده است.
ویرایشگر کد (جاوا اسکریپت)
// Import the example feature collection and subset the forest feature.
var forest = ee.FeatureCollection('projects/google/charts_feature_example')
                 .filter(ee.Filter.eq('label', 'Forest'));

// Load MODIS vegetation indices data and subset a decade of images.
var vegIndices = ee.ImageCollection('MODIS/061/MOD13A1')
                     .filter(ee.Filter.date('2010-01-01', '2020-01-01'))
                     .select(['NDVI', 'EVI']);

// Define a function to format an image timestamp as a JavaScript Date string.
function formatDate(img) {
  var millis = img.date().millis().format();
  return ee.String('Date(').cat(millis).cat(')');
}

// Build a feature collection where each feature has a property that represents
// a DataFrame row.
var reductionTable = vegIndices.map(function(img) {
  // Reduce the image to the mean of pixels intersecting the forest ecoregion.
  var stat = img.reduceRegion(
      {reducer: ee.Reducer.mean(), geometry: forest, scale: 500});

  // Extract the reduction results along with the image date.
  var date = formatDate(img);   // x-axis values.
  var evi = stat.get('EVI');    // y-axis series 1 values.
  var ndvi = stat.get('NDVI');  // y-axis series 2 values.

  // Make a list of observation attributes to define a row in the DataTable.
  var row = ee.List([date, evi, ndvi]);

  // Return the row as a property of an ee.Feature.
  return ee.Feature(null, {'row': row});
});

// Aggregate the 'row' property from all features in the new feature collection
// to make a server-side 2-D list (DataTable).
var dataTableServer = reductionTable.aggregate_array('row');

// Define column names and properties for the DataTable. The order should
// correspond to the order in the construction of the 'row' property above.
var columnHeader = ee.List([[
  {label: 'Date', role: 'domain', type: 'date'},
  {label: 'EVI', role: 'data', type: 'number'},
  {label: 'NDVI', role: 'data', type: 'number'}
]]);

// Concatenate the column header to the table.
dataTableServer = columnHeader.cat(dataTableServer);

// Use 'evaluate' to transfer the server-side table to the client, define the
// chart and print it to the console.
dataTableServer.evaluate(function(dataTableClient) {
  var chart = ui.Chart(dataTableClient).setOptions({
    title: 'Average Vegetation Index Value by Date for Forest',
    hAxis: {
      title: 'Date',
      titleTextStyle: {italic: false, bold: true},
    },
    vAxis: {
      title: 'Vegetation index (x1e4)',
      titleTextStyle: {italic: false, bold: true}
    },
    lineWidth: 5,
    colors: ['e37d05', '1d6b99'],
    curveType: 'function'
  });
  print(chart);
});
نمودار بازه
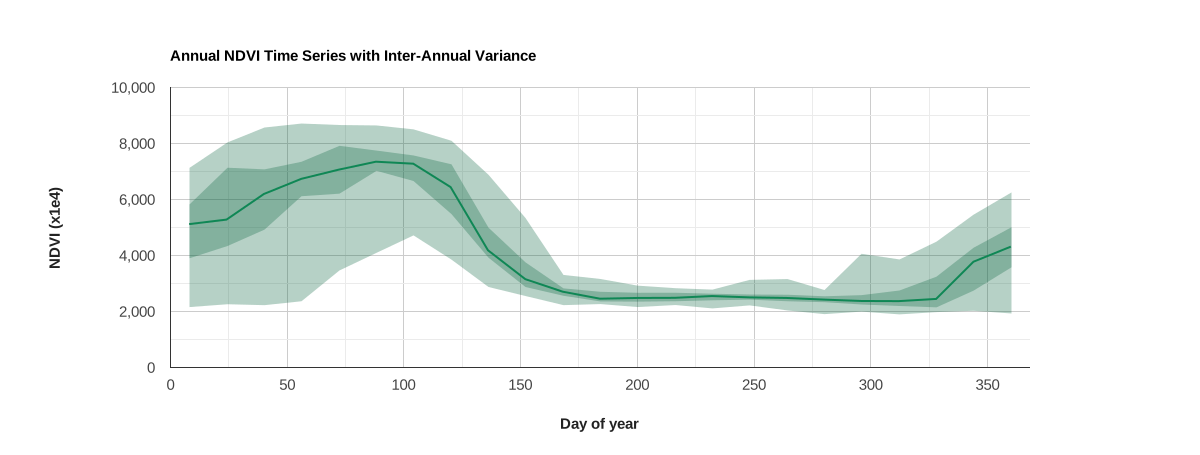
این نمودار از ویژگی ستون DataTable 'role'
برای تولید نمودار بازهای استفاده میکند.
این نمودار نمایه NDVI سالانه و واریانس بینسالانه را برای پیکسلی در نزدیکی مونتری، کالیفرنیا نشان میدهد.
میانه بینسالی بهصورت خط نشان داده میشود، درحالیکه دامنههای مطلق و بینچارکی بهصورت باند نشان داده میشوند. ستونهای جدول که نشاندهنده هر بازه هستند
با تنظیم ویژگی ستون 'role' بهعنوان 'interval' اختصاص داده میشوند. با تنظیم کردن ویژگی نمودار intervals.style روی 'area'، نوارهایی در اطراف خط میانه کشیده میشود.
ویرایشگر کد (جاوا اسکریپت)
// Define a point to extract an NDVI time series for.
var geometry = ee.Geometry.Point([-121.679, 36.479]);

// Define a band of interest (NDVI), import the MODIS vegetation index dataset,
// and select the band.
var band = 'NDVI';
var ndviCol = ee.ImageCollection('MODIS/061/MOD13Q1').select(band);

// Map over the collection to add a day of year (doy) property to each image.
ndviCol = ndviCol.map(function(img) {
  var doy = ee.Date(img.get('system:time_start')).getRelative('day', 'year');
  // Add 8 to day of year number so that the doy label represents the middle of
  // the 16-day MODIS NDVI composite.
  return img.set('doy', ee.Number(doy).add(8));
});

// Join all coincident day of year observations into a set of image collections.
var distinctDOY = ndviCol.filterDate('2013-01-01', '2014-01-01');
var filter = ee.Filter.equals({leftField: 'doy', rightField: 'doy'});
var join = ee.Join.saveAll('doy_matches');
var joinCol = ee.ImageCollection(join.apply(distinctDOY, ndviCol, filter));

// Calculate the absolute range, interquartile range, and median for the set
// of images composing each coincident doy observation group. The result is
// an image collection with an image representative per unique doy observation
// with bands that describe the 0, 25, 50, 75, 100 percentiles for the set of
// coincident doy images.
var comp = ee.ImageCollection(joinCol.map(function(img) {
  var doyCol = ee.ImageCollection.fromImages(img.get('doy_matches'));

  return doyCol
      .reduce(ee.Reducer.percentile(
          [0, 25, 50, 75, 100], ['p0', 'p25', 'p50', 'p75', 'p100']))
      .set({'doy': img.get('doy')});
}));

// Extract the inter-annual NDVI doy percentile statistics for the
// point of interest per unique doy representative. The result is
// is a feature collection where each feature is a doy representative that
// contains a property (row) describing the respective inter-annual NDVI
// variance, formatted as a list of values.
var reductionTable = comp.map(function(img) {
  var stats = ee.Dictionary(img.reduceRegion(
      {reducer: ee.Reducer.first(), geometry: geometry, scale: 250}));

  // Order the percentile reduction elements according to how you want columns
  // in the DataTable arranged (x-axis values need to be first).
  var row = ee.List([
    img.get('doy'),            // x-axis, day of year.
    stats.get(band + '_p50'),  // y-axis, median.
    stats.get(band + '_p0'),   // y-axis, min interval.
    stats.get(band + '_p25'),  // y-axis, 1st quartile interval.
    stats.get(band + '_p75'),  // y-axis, 3rd quartile interval.
    stats.get(band + '_p100')  // y-axis, max interval.
  ]);

  // Return the row as a property of an ee.Feature.
  return ee.Feature(null, {row: row});
});

// Aggregate the 'row' properties to make a server-side 2-D array (DataTable).
var dataTableServer = reductionTable.aggregate_array('row');

// Define column names and properties for the DataTable. The order should
// correspond to the order in the construction of the 'row' property above.
var columnHeader = ee.List([[
  {label: 'Day of year', role: 'domain'},
  {label: 'Median', role: 'data'},
  {label: 'p0', role: 'interval'},
  {label: 'p25', role: 'interval'},
  {label: 'p75', role: 'interval'},
  {label: 'p100', role: 'interval'}
]]);

// Concatenate the column header to the table.
dataTableServer = columnHeader.cat(dataTableServer);

// Use 'evaluate' to transfer the server-side table to the client, define the
// chart and print it to the console.
dataTableServer.evaluate(function(dataTableClient) {
  var chart = ui.Chart(dataTableClient).setChartType('LineChart').setOptions({
    title: 'Annual NDVI Time Series with Inter-Annual Variance',
    intervals: {style: 'area'},
    hAxis: {
      title: 'Day of year',
      titleTextStyle: {italic: false, bold: true},
    },
    vAxis: {title: 'NDVI (x1e4)', titleTextStyle: {italic: false, bold: true}},
    colors: ['0f8755'],
    legend: {position: 'none'}
  });
  print(chart);
});
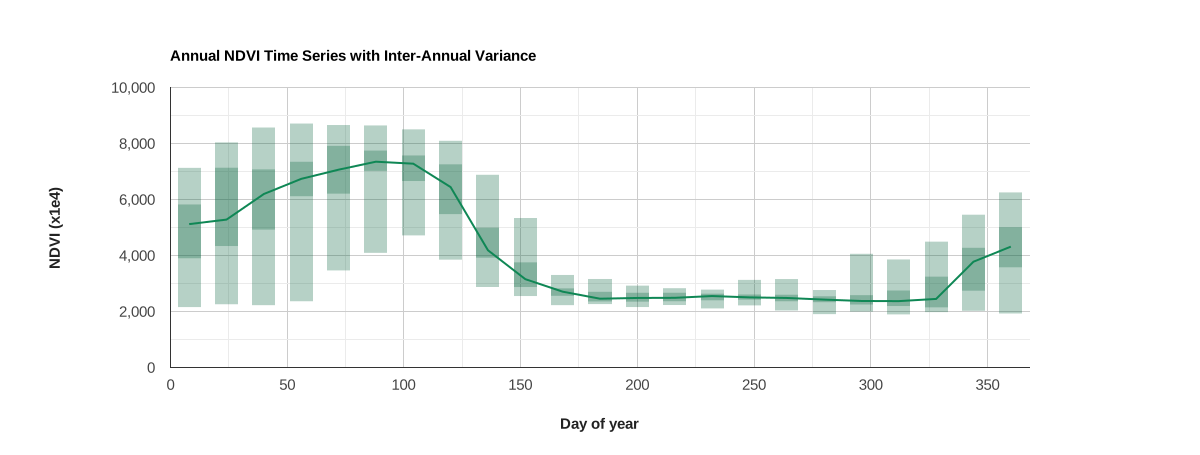
راههای زیادی برای نمایش فاصلهها وجود دارد. در مثال زیر، با تغییر دادن ویژگی intervals.style به 'boxes'
با سبک جعبه مربوطه، بهجای نوار از جعبه استفاده شده است.
dataTableServer.evaluate(function(dataTableClient) {
  var chart = ui.Chart(dataTableClient).setChartType('LineChart').setOptions({
    title: 'Annual NDVI Time Series with Inter-Annual Variance',
    intervals: {style: 'boxes', barWidth: 1, boxWidth: 1, lineWidth: 0},
    hAxis: {
      title: 'Day of year',
      titleTextStyle: {italic: false, bold: true},
    },
    vAxis: {title: 'NDVI (x1e4)', titleTextStyle: {italic: false, bold: true}},
    colors: ['0f8755'],
    legend: {position: 'none'}
  });
  print(chart);
});