कलेक्शन को जगह की जानकारी के साथ-साथ प्रॉपर्टी वैल्यू के हिसाब से भी जोड़ा जा सकता है. जगह के हिसाब से जोड़ने के लिए, .geo जॉइन फ़ील्ड के साथ withinDistance() फ़िल्टर का इस्तेमाल करें. .geo फ़ील्ड से पता चलता है कि दूरी की मेट्रिक का हिसाब लगाने के लिए, आइटम की ज्यामिति का इस्तेमाल किया जाना है. उदाहरण के लिए, अमेरिका के योसेमिटी नेशनल पार्क से 100 किलोमीटर के दायरे में मौजूद सभी
बिजलीघर ढूंढने का टास्क लें. इसके लिए, ज्यामिति फ़ील्ड पर फ़िल्टर का इस्तेमाल करें. साथ ही, distance
पैरामीटर का इस्तेमाल करके, ज़्यादा से ज़्यादा दूरी को 100 किलोमीटर पर सेट करें:
कोड एडिटर (JavaScript)
// Load a primary collection: protected areas (Yosemite National Park).
var primary = ee.FeatureCollection("WCMC/WDPA/current/polygons")
  .filter(ee.Filter.eq('NAME', 'Yosemite National Park'));

// Load a secondary collection: power plants.
var powerPlants = ee.FeatureCollection('WRI/GPPD/power_plants');

// Define a spatial filter, with distance 100 km.
var distFilter = ee.Filter.withinDistance({
  distance: 100000,
  leftField: '.geo',
  rightField: '.geo',
  maxError: 10
});

// Define a saveAll join.
var distSaveAll = ee.Join.saveAll({
  matchesKey: 'points',
  measureKey: 'distance'
});

// Apply the join.
var spatialJoined = distSaveAll.apply(primary, powerPlants, distFilter);

// Print the result.
print(spatialJoined);
import ee
import geemap.core as geemap
Colab (Python)
# Load a primary collection: protected areas (Yosemite National Park).
primary = ee.FeatureCollection('WCMC/WDPA/current/polygons').filter(
    ee.Filter.eq('NAME', 'Yosemite National Park')
)

# Load a secondary collection: power plants.
power_plants = ee.FeatureCollection('WRI/GPPD/power_plants')

# Define a spatial filter, with distance 100 km.
dist_filter = ee.Filter.withinDistance(
    distance=100000, leftField='.geo', rightField='.geo', maxError=10
)

# Define a saveAll join.
dist_save_all = ee.Join.saveAll(matchesKey='points', measureKey='distance')

# Apply the join.
spatial_joined = dist_save_all.apply(primary, power_plants, dist_filter)

# Print the result.
display(spatial_joined)
ध्यान दें कि पिछले उदाहरण में, एक FeatureCollection को किसी दूसरे
FeatureCollection से जोड़ा गया है. saveAll() जॉइन, primary कलेक्शन में मौजूद हर फ़ीचर पर एक प्रॉपर्टी (points) सेट करता है. यह प्रॉपर्टी, फ़ीचर के 100 कि॰मी॰ के दायरे में मौजूद पॉइंट की सूची सेव करती है. हर पॉइंट से,
सुविधा की दूरी को जॉइन किए गए हर पॉइंट की distance प्रॉपर्टी में सेव किया जाता है.
स्पेस डेटा जॉइन का इस्तेमाल यह पता लगाने के लिए भी किया जा सकता है कि एक कलेक्शन में मौजूद कौनसी सुविधाएं, दूसरे कलेक्शन में मौजूद सुविधाओं से इंटरसेक्शन करती हैं. उदाहरण के लिए, दो फ़ीचर कलेक्शन पर विचार करें: पहला primary कलेक्शन, जिसमें अमेरिका के राज्यों की सीमाओं को दिखाने वाले पॉलीगॉन शामिल हैं. दूसरा secondary कलेक्शन, जिसमें पावर प्लांट की जगहों को दिखाने वाले पॉइंट शामिल हैं. मान लें कि आपको हर राज्य के साथ इंटरसेक्शन वाली संख्या का पता लगाना है. स्पेस ज़्योंन की मदद से, ऐसा करने का तरीका यहां बताया गया है:
कोड एडिटर (JavaScript)
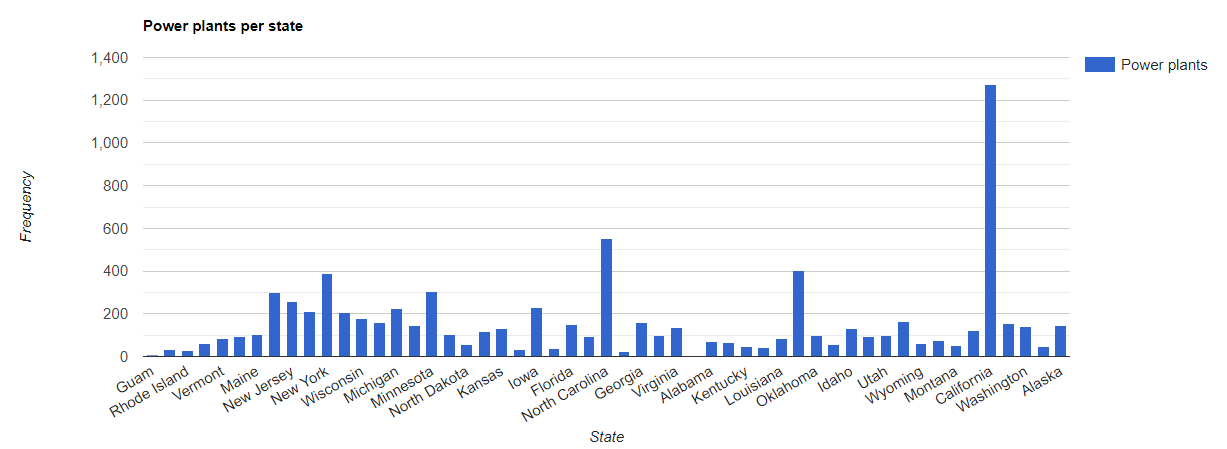
// Load the primary collection: US state boundaries.
var states = ee.FeatureCollection('TIGER/2018/States');

// Load the secondary collection: power plants.
var powerPlants = ee.FeatureCollection('WRI/GPPD/power_plants');

// Define a spatial filter as geometries that intersect.
var spatialFilter = ee.Filter.intersects({
  leftField: '.geo',
  rightField: '.geo',
  maxError: 10
});

// Define a save all join.
var saveAllJoin = ee.Join.saveAll({
  matchesKey: 'power_plants',
});

// Apply the join.
var intersectJoined = saveAllJoin.apply(states, powerPlants, spatialFilter);

// Add power plant count per state as a property.
intersectJoined = intersectJoined.map(function(state) {
  // Get "power_plant" intersection list, count how many intersected this state.
  var nPowerPlants = ee.List(state.get('power_plants')).size();
  // Return the state feature with a new property: power plant count.
  return state.set('n_power_plants', nPowerPlants);
});

// Make a bar chart for the number of power plants per state.
var chart = ui.Chart.feature.byFeature(intersectJoined, 'NAME', 'n_power_plants')
  .setChartType('ColumnChart')
  .setSeriesNames({n_power_plants: 'Power plants'})
  .setOptions({
    title: 'Power plants per state',
    hAxis: {title: 'State'},
    vAxis: {title: 'Frequency'}});

// Print the chart to the console.
print(chart);
पिछले उदाहरण में, ध्यान दें कि intersects() फ़िल्टर, withinDistance() फ़िल्टर की तरह दूरी सेव नहीं करता. आउटपुट कुछ ऐसा दिखना चाहिए
जैसा पहली इमेज में दिखाया गया है.