تنظيم صفحاتك في مجموعات
يمكنك حفظ المحتوى وتصنيفه حسب إعداداتك المفضّلة.
Earth Engine هي أداة تحليلية فعّالة، ولكن قد تحتاج إلى تصدير نتائج التحليل لتضمين رسوم بيانية وصور وخرائط وما إلى ذلك في التقارير أو المنشورات. في هذا القسم، ستتعرّف على كيفية إنشاء رسومات بيانية وصور
يمكن تصديرها وعرضها في برامج أخرى. تذكَّر أنّه في القسم السابق، استخدمت رمزًا برمجيًا مشابهًا لما يلي لإضافة نطاق NDVI إلى كل صورة في مجموعة، حيث يشير المتغيّر l8 إلى مجموعة بيانات انعكاس Landsat 8 TOA:
لنفترض أنّ ما تريده هو في الواقع رسم بياني لقيمة NDVI بمرور الوقت في موقع جغرافي معيّن. لإنشاء مثل هذا الرسم البياني، تتمثل الخطوة الأولى في اختيار موقع جغرافي يهمّك. أنشئ نقطة
من خلال الحصول على أداة رسم النقاط ()
وإنشاء شكل هندسي بنقطة واحدة في منطقة اهتمامك. (إذا كانت لديك عمليات استيراد، مرِّر المؤشر فوق عمليات استيراد الأشكال الهندسية وانقر على + طبقة جديدة أولاً).
تحديد الموقع الجغرافي للنقطة في منطقة زراعية أو غابة نفضية أو مرعى سنوي أو بعض أنواع الغطاء الأرضي الأخرى التي تتكرر دوريًا كل عام أدخِل اسمًا لعملية الاستيراد roi. (راجِع
هذه الصفحة للحصول على معلومات حول إنشاء أشكال هندسية
برمجيًا).
لنستخدِم الآن النقطة roi لإنشاء رسم بياني لقيم NDVI بمرور الوقت في البكسل الواقع تحت تلك النقطة. يمكن إنشاء الرسوم البيانية في Earth Engine باستخدام حزمة ui.Chart. (مزيد من المعلومات حول إنشاء الرسومات البيانية في Earth Engine)
على وجه التحديد، لإنشاء رسم بياني بمرور الوقت، يمكنك استخدام طريقة ui.Chart.image.series():
بالنسبة إلى الشكل الهندسي roi، اخترنا نقطة في منطقة زراعية، ما أدّى إلى ظهور رسم بياني يشبه الشكل 10. يُرجى العِلم أنّ مَعلمات الدالة الإنشائية للرسم البياني تتضمّن دالة اختزال ومقياسًا مثل reduceRegion(). بما أنّ النقطة التي نقدّمها كمنطقة لا يمكن أن تتقاطع إلا مع بكسل واحد، يكفي استخدام أداة الاختزال "الأولى". إذا كان لديك منطقة أكبر، عليك استخدام دالة تقليل "المتوسط" أو دالة تقليل أخرى تحدّد كيفية تجميع وحدات البكسل. يُرجى العِلم أيضًا أنّه لعرض رسم بياني، كل ما عليك فعله هو طباعته.
الشكل 10. رسم بياني لقيم NDVI في Landsat على مدار الوقت في شكل هندسي نقطي
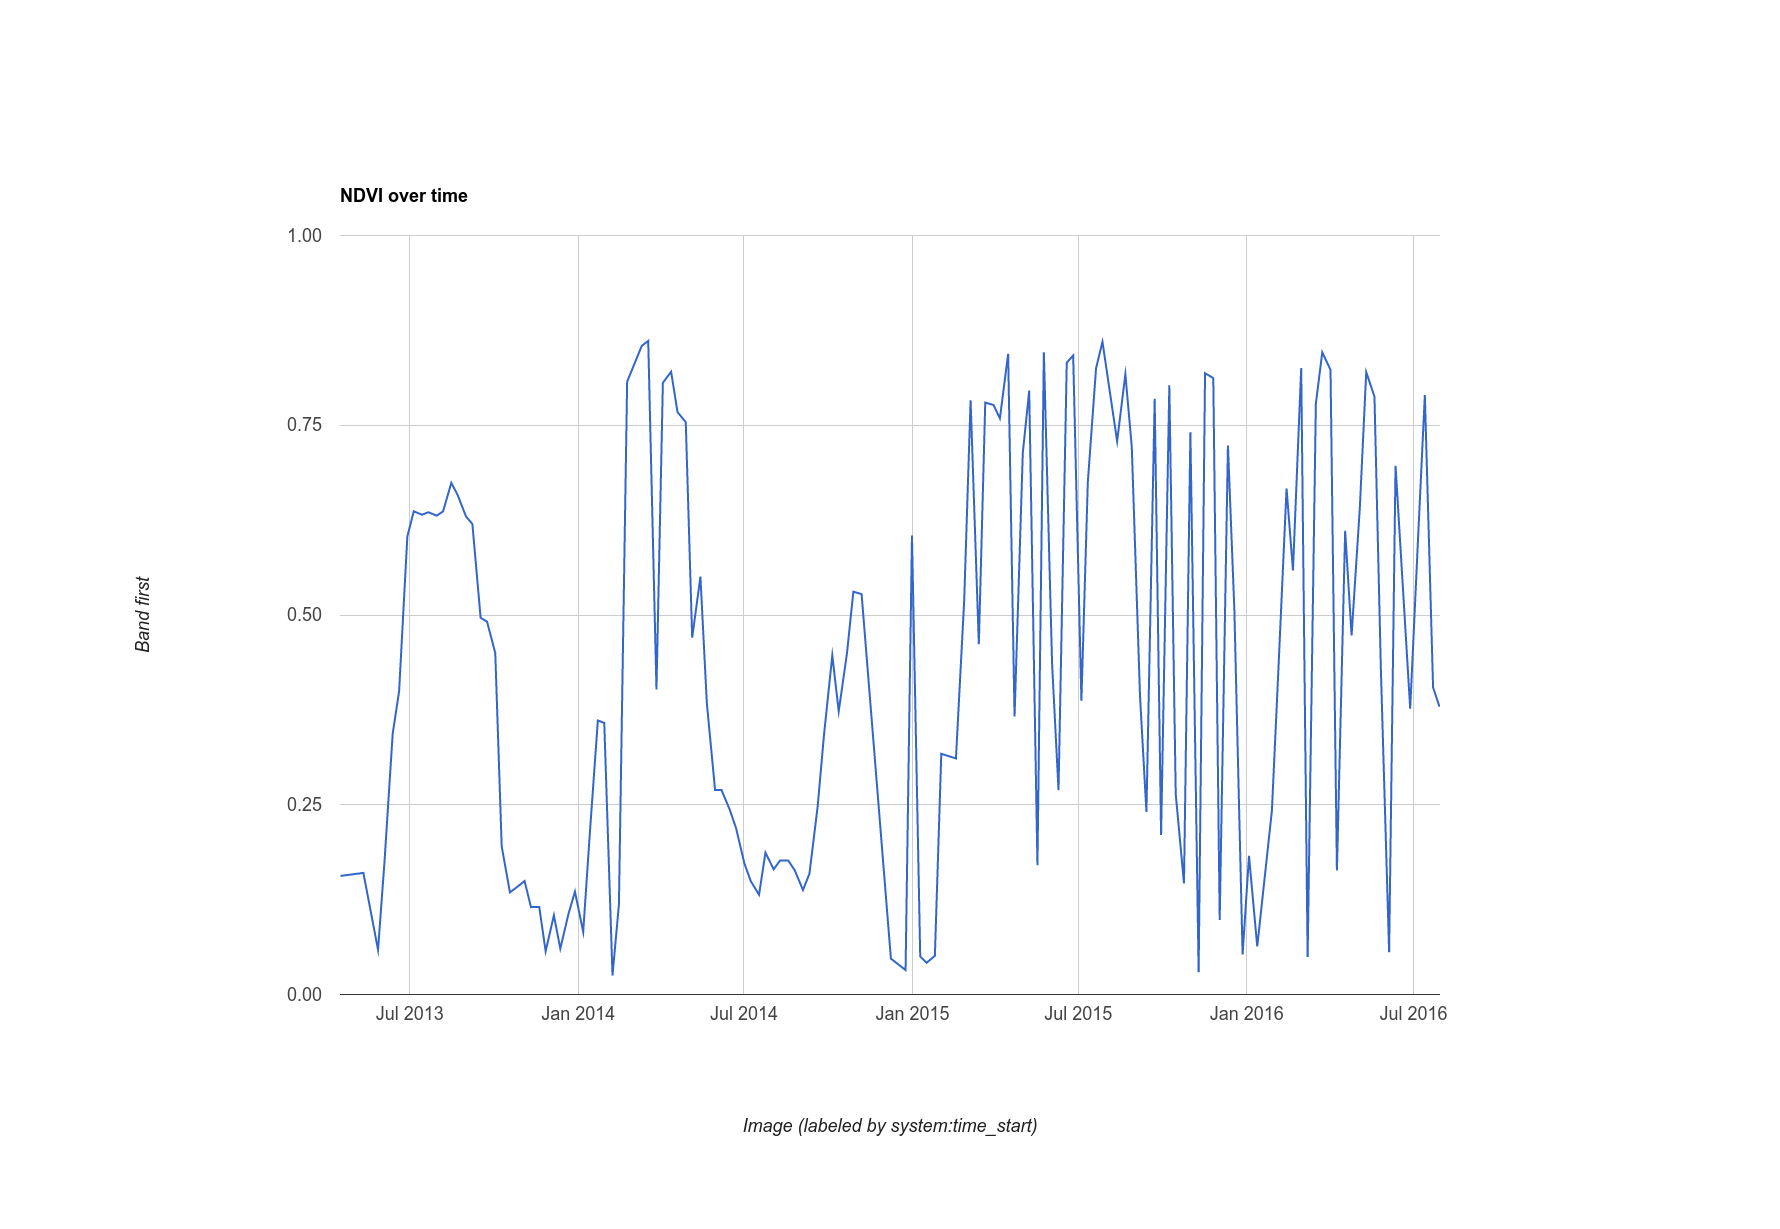
استطراد: إخفاء بسيط للسحب في صور Landsat
قد تكون لاحظت أنّ السلسلة الزمنية لقيم NDVI في هذه النقطة تبدو غير منتظمة بعض الشيء. من المحتمل أن يكون السبب هو الغيوم. للتخفيف من هذا التأثير، يتضمّن Earth Engine خوارزمية لإخفاء السحب في بيانات أدوات استشعار Landsat التي تتضمّن نطاقًا حراريًا: ee.Algorithms.Landsat.simpleCloudScore(). تتلقّى هذه الدالة صورة انعكاس TOA من Landsat كمدخل، وتضيف نطاقًا باسم cloud، وهو فهرس لمدى تلبّد السماء بالغيوم في البكسل، ويتراوح بين صفر و100، من الأقل إلى الأكثر تلبّدًا بالغيوم على التوالي. من خلال تعديل الدالة التي تم ربطها بالمجموعة، يمكنك استخدام حد عشوائي (20) في فهرس السحابة لتنظيف الرسم البياني قليلاً:
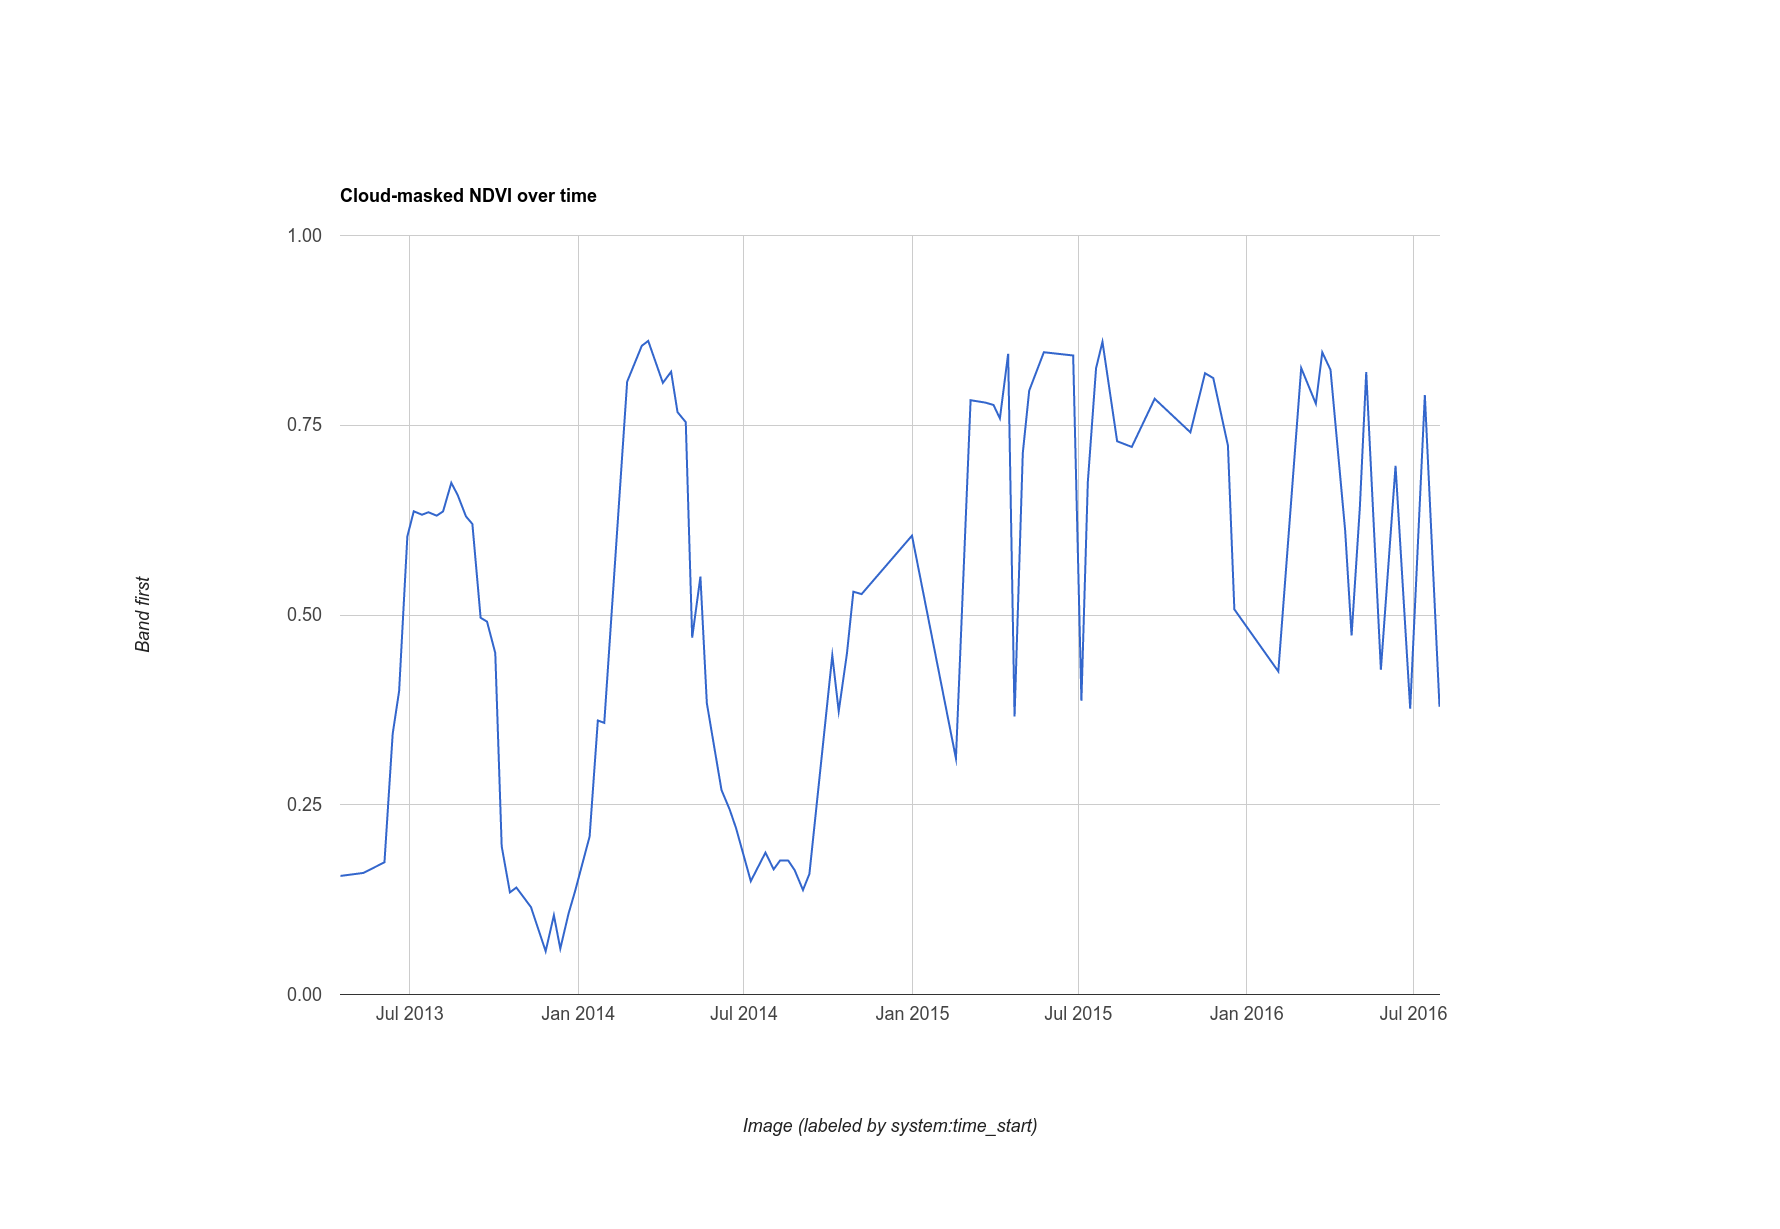
يتم توضيح النتيجة التي تم إخفاء الغيوم فيها في الشكل 11. يُرجى العِلم أنّ السلسلة الزمنية تبدو أكثر سلاسة، ولكن قد تظل تتضمّن وحدات بكسل متأثرة بالسُحب. عدِّل الحدّ الأدنى
في الفهرس المستند إلى السحابة الإلكترونية وراقِب السلسلة الزمنية الموضّحة في الرسم البياني لمعرفة كيف يمكن أن يؤثّر هذا الحدّ الأدنى في نتائجك.
الشكل 11. رسم بياني لقيم NDVI التي تم إخفاء الغيوم فيها بمرور الوقت في شكل هندسي نقطي
تصدير الصور
لقد رأيت طريقة لتصدير رسم بياني للبيانات التي تم احتسابها بواسطة Earth Engine، ولكن ماذا عن صورة كاملة؟ لنفترض مثلاً أنّك أنشأت صورة مركّبة بأكثر وحدات البكسل خضرة
كما هو موضّح في
القسم السابق:
الاختلاف الوحيد في هذا الرمز عن الرمز الذي استخدمته سابقًا هو أنّنا نستخدم الآن المجموعة المحجوبة في السحابة الإلكترونية. يمكنك تصدير مجموعة فرعية (محدّدة بمنطقة) من هذا
باستخدام حزمة Export. (مزيد من المعلومات عن تصدير بيانات نقطية ومتجهة من Earth Engine) على سبيل المثال، لتصدير صورة يمكن تضمينها بسهولة في مستندات أخرى، لننشئ صورة تمثيلية، كما فعلت سابقًا، ثم نصدّرها إلى مجلد Google Drive:
عند تشغيل هذا الرمز، لاحظ أنّه يتم إنشاء مهمة جديدة في علامة التبويب المهام.
لبدء مربع حوار إعدادات التصدير، انقر على الزر تنفيذ في علامة التبويب المهام. بعد ضبط المهمة، انقر على الزر تشغيل في مربّع الحوار لبدء عملية التصدير. ولكن قبل أن تفعل ذلك، ننصحك بما يلي:
السبب الذي يستدعي توخّي الحذر عند التصدير بدون وسيطة region هو أنّه في حال ضبط قيمة صغيرة نسبيًا لـ scale، وتم تصغير الخريطة إلى منطقة كبيرة، سيتم تصدير صورة كبيرة جدًا إلى مجلد Drive. يمكنك الاطّلاع على مستندات Export.image.toDrive() في علامة التبويب المستندات لمعرفة المزيد من التفاصيل وقائمة بمَعلمات الضبط المحتملة.
بهذا نكون قد أنهينا هذه المقدمة عن Earth Engine API. لقد تعرّفت الآن على معظم وظائف Earth Engine الشائعة، ويجب أن تكون قادرًا على الانتقال بثقة إلى عمليات تحليل أكثر تعقيدًا. احرص على قراءة المستندات والبحث في
المنتدى
للحصول على إجابات عن الأسئلة الأخرى. نتمنّى لك التوفيق في الترميز.
تاريخ التعديل الأخير: 2025-07-27 (حسب التوقيت العالمي المتفَّق عليه)
[null,null,["تاريخ التعديل الأخير: 2025-07-27 (حسب التوقيت العالمي المتفَّق عليه)"],[[["\u003cp\u003eThis tutorial explains how to export Earth Engine analysis results, like charts and images, for use in external reports or publications.\u003c/p\u003e\n"],["\u003cp\u003eIt demonstrates charting NDVI trends over time using \u003ccode\u003eui.Chart.image.series()\u003c/code\u003e, including applying cloud masking for data refinement.\u003c/p\u003e\n"],["\u003cp\u003eUsers learn to export images, such as a greenest-pixel composite, to Google Drive using the \u003ccode\u003eExport.image.toDrive()\u003c/code\u003e function, emphasizing the importance of specifying a region to control image size.\u003c/p\u003e\n"],["\u003cp\u003eThe tutorial highlights the need for cloud masking to improve data quality and provides a basic example using \u003ccode\u003eee.Algorithms.Landsat.simpleCloudScore()\u003c/code\u003e.\u003c/p\u003e\n"],["\u003cp\u003eIt encourages further exploration of Earth Engine functionalities through documentation and the user forum.\u003c/p\u003e\n"]]],[],null,["# Exporting Charts and Images\n\nEarth Engine is a powerful analytical tool, but you may have need to export the results\nof your analysis in order to embed charts, images, maps, etc. into reports or\npublications. In this section, you will learn how to create charts and images\nthat can be exported and viewed in other software. Recall that in the\n[previous section](/earth-engine/tutorials/tutorial_api_06), you used code like the following to add an\nNDVI band to every image in a collection, where the `l8` variable references the\n[Landsat 8 TOA reflectance\ncollection](/earth-engine/datasets/catalog/LANDSAT_LC8_L1T_TOA):\n\n### Code Editor (JavaScript)\n\n```javascript\n// Import the Landsat 8 TOA image collection.\nvar l8 = ee.ImageCollection('LANDSAT/LC08/C02/T1_TOA');\n\n// Map a function over the Landsat 8 TOA collection to add an NDVI band.\nvar withNDVI = l8.map(function(image) {\n var ndvi = image.normalizedDifference(['B5', 'B4']).rename('NDVI');\n return image.addBands(ndvi);\n});\n```\n\nCharting\n--------\n\nSuppose that what you want is actually a chart of NDVI over time at a given location. To\nmake such a chart, the first step is to choose a location of interest. Create a point\nby getting the point drawing tool ()\nand make a single point geometry in your area of interest. (If you already have imports,\nhover on **Geometry Imports** and click **+ new layer** first).\nLocate the point in an area of agriculture, deciduous forest, annual grassland or some\nother land cover with an annual cycle). Name the import `roi`. (See\n[this page](/earth-engine/guides/geometries) for information about creating geometries\nprogrammatically).\n\nNow let's use the `roi` point to make a chart of NDVI over time in the pixel\nunder that point. The way to make charts in Earth Engine is with the `ui.Chart`\npackage. ([Learn more about making charts in Earth Engine](/earth-engine/guides/charts)).\nSpecifically, to make a chart over time, you can use the\n`ui.Chart.image.series()` method:\n\n### Code Editor (JavaScript)\n\n```javascript\n// Create a chart.\nvar chart = ui.Chart.image.series({\n imageCollection: withNDVI.select('NDVI'),\n region: roi,\n reducer: ee.Reducer.first(),\n scale: 30\n}).setOptions({title: 'NDVI over time'});\n\n// Display the chart in the console.\nprint(chart);\n```\n\nFor the `roi` geometry, we chose a point in an agricultural area, resulting\nin a chart that looks something like Figure 10. Note that the parameters to the chart\nconstructor include a reducer and scale like `reduceRegion()`. Since the\npoint we are providing as a region can only intersect one pixel, it suffices to use the\n'first' reducer. If you have a larger region, you should use a 'mean' or other reducer\nthat specifies how to aggregate pixels. Also note that to visualize a chart, all you\nhave to do is print it.\nFigure 10. Chart of Landsat NDVI over time at a point geometry. **Note:** The upper right corner of the chart contains a little pop-out icon (open_in_new). Click that icon to get a new tab with a version of the chart that can be downloaded in a variety of formats. See the `ui.Chart` section of the **Docs** tab for a complete list of the charting options in Earth Engine.\n\nDigression: Simple Cloud Masking for Landsat\n--------------------------------------------\n\nSomething you may have noticed about this chart is that the time series of NDVI values\nat the point looks a little noisy. This is likely due to clouds. To ameliorate this\neffect, Earth Engine includes a cloud-masking algorithm for Landsat sensors with a\nthermal band: `ee.Algorithms.Landsat.simpleCloudScore()`. It takes a Landsat TOA\nreflectance image as input and adds a band named `cloud` which is an index\nof cloudiness in the pixel from zero to 100, from least to most cloudy, respectively. By\nmodifying the function you mapped over the collection, you can use an arbitrary\nthreshold (20) on the cloud index to clean up the chart a bit:\n\n### Code Editor (JavaScript)\n\n```javascript\nvar cloudlessNDVI = l8.map(function(image) {\n // Get a cloud score in [0, 100].\n var cloud = ee.Algorithms.Landsat.simpleCloudScore(image).select('cloud');\n\n // Create a mask of cloudy pixels from an arbitrary threshold.\n var mask = cloud.lte(20);\n\n // Compute NDVI.\n var ndvi = image.normalizedDifference(['B5', 'B4']).rename('NDVI');\n\n // Return the masked image with an NDVI band.\n return image.addBands(ndvi).updateMask(mask);\n});\n\nprint(ui.Chart.image.series({\n imageCollection: cloudlessNDVI.select('NDVI'),\n region: roi,\n reducer: ee.Reducer.first(),\n scale: 30\n}).setOptions({title: 'Cloud-masked NDVI over time'}));\n```\n\nThe cloud-masked result is illustrated in Figure 11. Note that the time series looks a\nlittle smoother, but may still contain pixels affected by clouds. Adjust the threshold\non the cloud index and observe the charted time series to learn how this threshold can\naffect your results.\nFigure 11. Chart of cloud-masked NDVI over time at a point geometry.\n\nExporting Images\n----------------\n\nYou have seen a way to export a chart of data computed by Earth Engine, but what about a\nwhole image? Suppose, for example that you have built a greenest-pixel composite\n[as discussed in the previous\nsection](/earth-engine/tutorials/tutorial_api_06#make-a-greenest-pixel-composite):\n\n### Code Editor (JavaScript)\n\n```javascript\nvar greenest = cloudlessNDVI.qualityMosaic('NDVI');\n```\n\nThe only difference in this code from what you did previously is that now we're using\nthe cloud masked collection. You can export a subset (defined by a region) of this\nusing the `Export` package. ([Learn more about exporting\nraster and vector data from Earth Engine](/earth-engine/guides/exporting).) For example, to export an image that can be\neasily embedded in other docs, let's create a visualization image,\n[as you've done previously](/earth-engine/tutorials/tutorial_api_05#mosaicking), an Export it to your\nGoogle Drive folder:\n\n### Code Editor (JavaScript)\n\n```javascript\n// Create a 3-band, 8-bit, color-IR composite to export.\nvar visualization = greenest.visualize({\n bands: ['B5', 'B4', 'B3'],\n max: 0.4\n});\n\n// Create a task that you can launch from the Tasks tab.\nExport.image.toDrive({\n image: visualization,\n description: 'Greenest_pixel_composite',\n scale: 30\n});\n```\n\nWhen you run this code, note that a new task is created in the **Tasks** tab.\nTo launch the export configuration dialog, click the **RUN** button in the\n**Tasks** tab. Once you've configured the task, click the **Run**\nbutton in the dialog to start the export. But before you do that, be warned:\n| **Caution:** If you don't specify a region, the Map bounds at the time the script is run will be used!\n\nThe reason you should exercise caution when exporting without a `region`\nargument is that if you set a relatively small value for `scale`, and the\nMap is zoomed out to large area, then you will export a potentially *very* large\nimage to your Drive folder. See the `Export.image.toDrive()` docs in the\n**Docs** tab for more details and a list of possible configuration parameters.\n\nThat concludes this introduction to the Earth Engine API! You have now seen much of\nthe most common Earth Engine functionality and should be able to confidently proceed to\nmore complex analyses. Be sure to [read the docs](/earth-engine/guides) and search the\n[forum](https://groups.google.com/forum/#!forum/google-earth-engine-developers)\nfor answers to other questions. Happy coding! \n[arrow_backPrevious page](/earth-engine/tutorials/tutorial_api_06)"]]