Earth Engine은 강력한 분석 도구이지만 차트, 이미지, 지도 등을 보고서나 간행물에 삽입하기 위해 분석 결과를 내보내야 할 수도 있습니다. 이 섹션에서는 다른 소프트웨어에서 내보내고 볼 수 있는 차트와 이미지를 만드는 방법을 알아봅니다. 이전 섹션에서 다음 코드와 같은 코드를 사용하여 컬렉션의 모든 이미지에 NDVI 밴드를 추가했습니다. 여기서 l8 변수는 Landsat 8 TOA 반사율 컬렉션을 참조합니다.
코드 편집기 (JavaScript)
// Import the Landsat 8 TOA image collection.
var l8 = ee.ImageCollection('LANDSAT/LC08/C02/T1_TOA');

// Map a function over the Landsat 8 TOA collection to add an NDVI band.
var withNDVI = l8.map(function(image) {
  var ndvi = image.normalizedDifference(['B5', 'B4']).rename('NDVI');
  return image.addBands(ndvi);
});
차트를 만드는 중입니다.
특정 위치에서 시간 경과에 따른 NDVI 차트를 원한다고 가정해 보겠습니다. 이러한 차트를 만들려면 먼저 관심 있는 위치를 선택해야 합니다. 점 그리기 도구 ( )를 가져와 관심 영역에 단일 점 지오메트리를 만들어 점을 만듭니다. (이미 가져온 항목이 있는 경우 먼저 지오메트리 가져오기에 마우스를 가져간 다음 + 새 레이어를 클릭합니다.)
농업 지역, 낙엽수림, 연간 초지 또는 연간 주기가 있는 기타 토지 피복 지역의 지점을 찾습니다. 가져오기 이름을
)를 가져와 관심 영역에 단일 점 지오메트리를 만들어 점을 만듭니다. (이미 가져온 항목이 있는 경우 먼저 지오메트리 가져오기에 마우스를 가져간 다음 + 새 레이어를 클릭합니다.)
농업 지역, 낙엽수림, 연간 초지 또는 연간 주기가 있는 기타 토지 피복 지역의 지점을 찾습니다. 가져오기 이름을 roi로 지정합니다. (프로그래매틱 방식으로 지오메트리를 만드는 방법에 대한 자세한 내용은 이 페이지를 참고하세요.)
이제 roi 포인트를 사용하여 해당 포인트 아래 픽셀의 시간 경과에 따른 NDVI 차트를 만들어 보겠습니다. Earth Engine에서 차트를 만드는 방법은 ui.Chart 패키지를 사용하는 것입니다. (Earth Engine에서 차트를 만드는 방법 자세히 알아보기)
특히 시간 경과에 따른 차트를 만들려면 ui.Chart.image.series() 메서드를 사용하면 됩니다.
코드 편집기 (JavaScript)
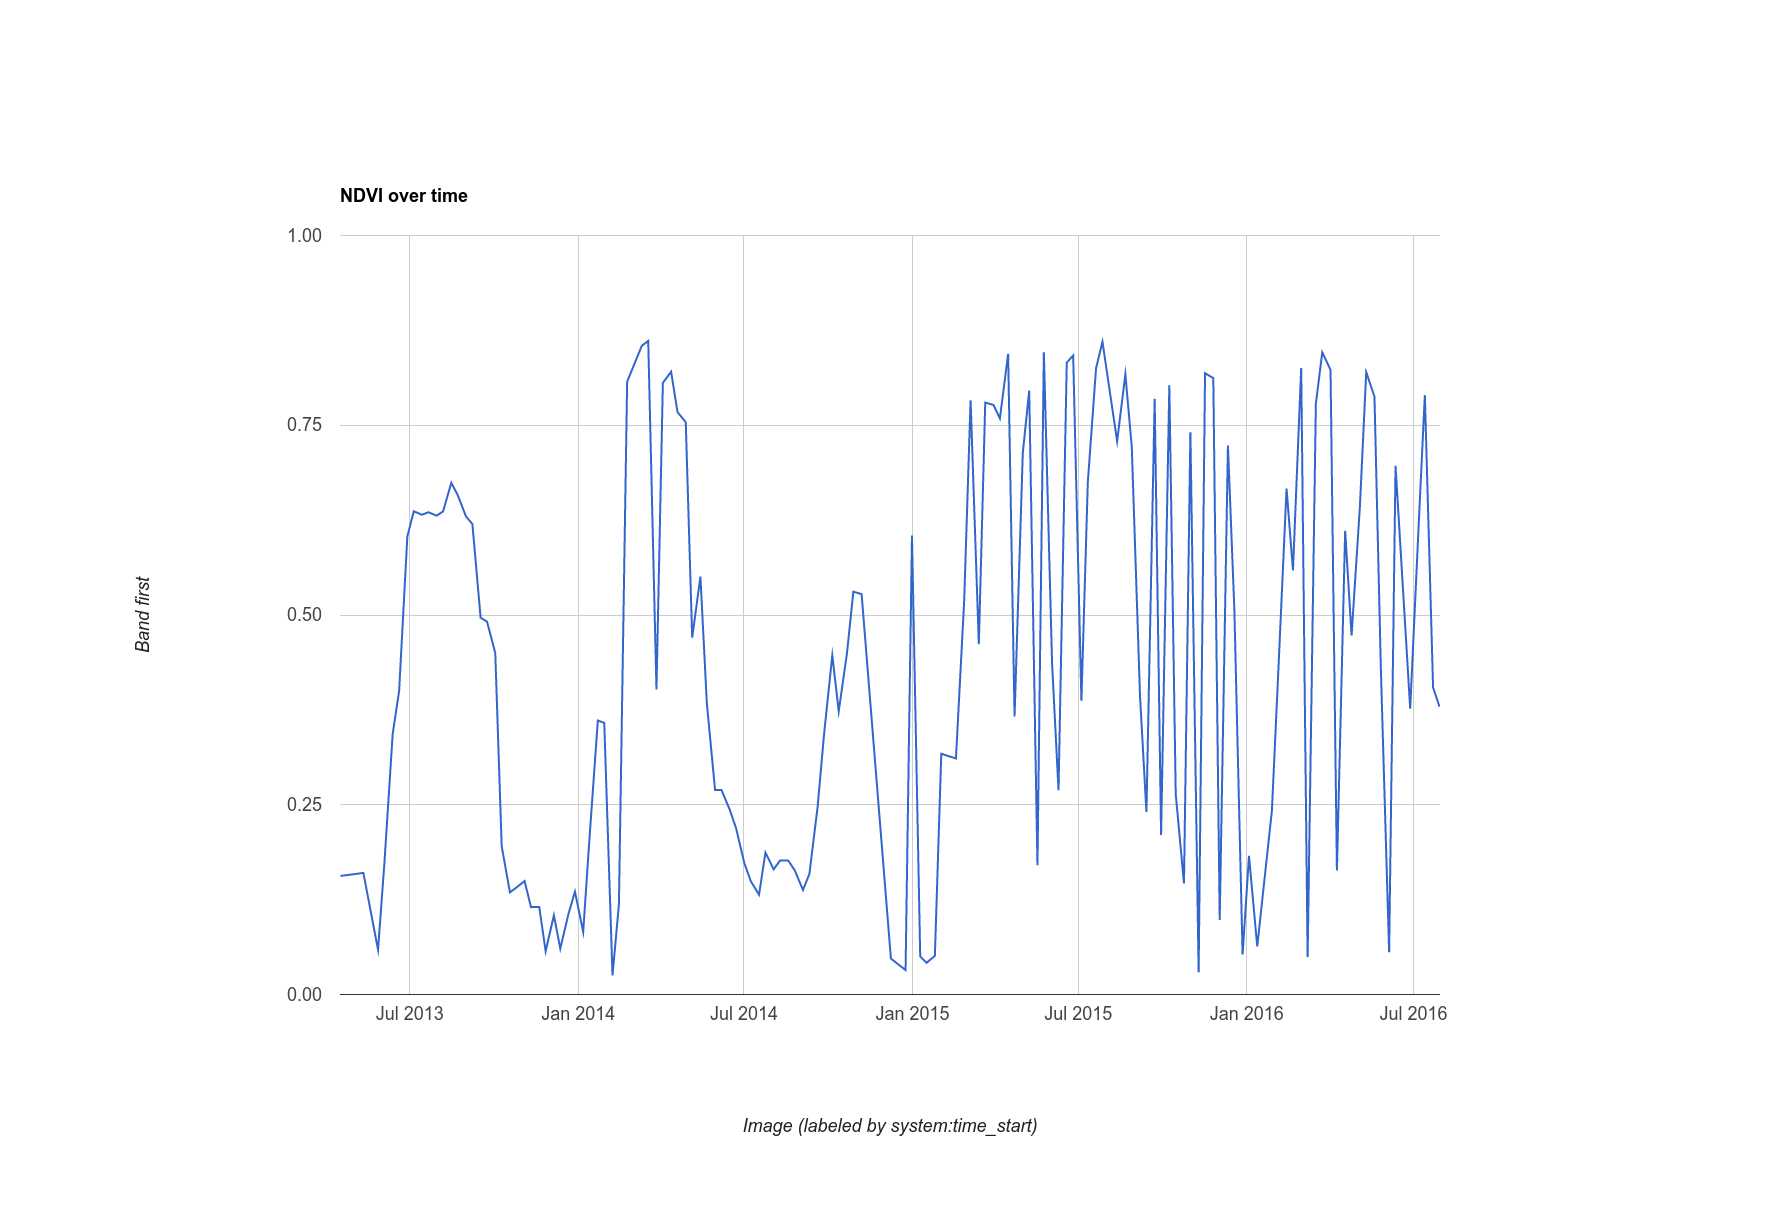
// Create a chart.
var chart = ui.Chart.image.series({
  imageCollection: withNDVI.select('NDVI'),
  region: roi,
  reducer: ee.Reducer.first(),
  scale: 30
}).setOptions({title: 'NDVI over time'});

// Display the chart in the console.
print(chart);
roi 형상의 경우 농업 지역의 한 지점을 선택하여 그림 10과 같은 차트를 얻었습니다. 차트 생성자의 매개변수에는 reduceRegion()와 같은 리듀서와 스케일이 포함됩니다. 영역으로 제공하는 점은 하나의 픽셀과만 교차할 수 있으므로 'first' 리듀서를 사용하면 됩니다. 영역이 더 큰 경우 픽셀을 집계하는 방법을 지정하는 '평균' 또는 기타 리듀서를 사용해야 합니다. 차트를 시각화하려면 차트를 출력하기만 하면 됩니다.
여담: Landsat의 간단한 클라우드 마스킹
이 차트에서 알 수 있는 점은 해당 지점의 NDVI 값 시계열이 약간 노이즈가 있다는 것입니다. 구름 때문일 수 있습니다. 이 효과를 개선하기 위해 Earth Engine에는 열 밴드가 있는 Landsat 센서용 클라우드 마스킹 알고리즘(ee.Algorithms.Landsat.simpleCloudScore())이 포함되어 있습니다. Landsat TOA 반사율 이미지를 입력으로 사용하고 cloud라는 밴드를 추가합니다. 이 밴드는 픽셀의 흐림 정도를 0에서 100까지 나타내는 지수로, 각각 흐림이 가장 적은 것부터 가장 많은 것까지 나타냅니다. 컬렉션에 매핑된 함수를 수정하면 클라우드 색인에서 임의의 기준점 (20)을 사용하여 차트를 약간 정리할 수 있습니다.
코드 편집기 (JavaScript)
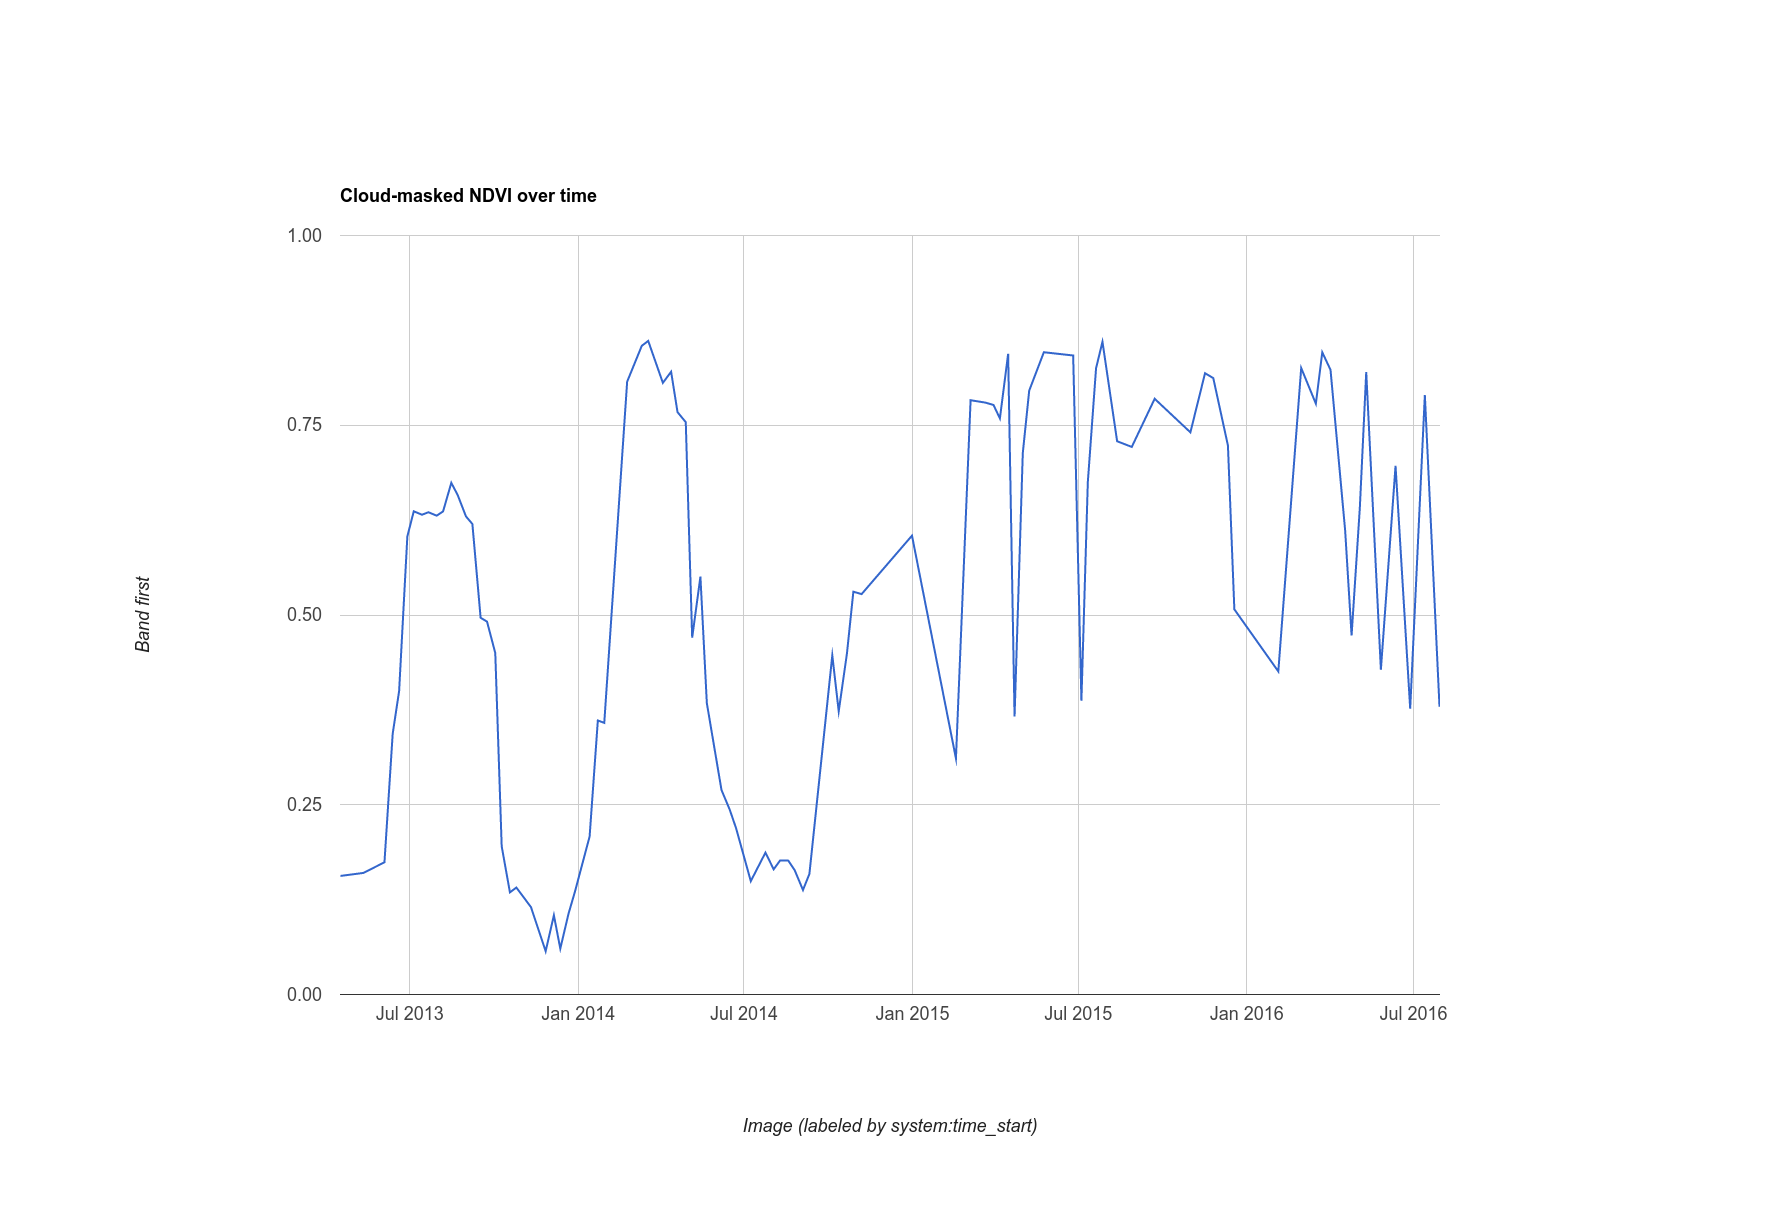
var cloudlessNDVI = l8.map(function(image) {
  // Get a cloud score in [0, 100].
  var cloud = ee.Algorithms.Landsat.simpleCloudScore(image).select('cloud');

  // Create a mask of cloudy pixels from an arbitrary threshold.
  var mask = cloud.lte(20);

  // Compute NDVI.
  var ndvi = image.normalizedDifference(['B5', 'B4']).rename('NDVI');

  // Return the masked image with an NDVI band.
  return image.addBands(ndvi).updateMask(mask);
});

print(ui.Chart.image.series({
  imageCollection: cloudlessNDVI.select('NDVI'),
  region: roi,
  reducer: ee.Reducer.first(),
  scale: 30
}).setOptions({title: 'Cloud-masked NDVI over time'}));
클라우드 마스크 처리된 결과는 그림 11에 나와 있습니다. 시계열이 약간 더 부드러워 보이지만 여전히 구름의 영향을 받는 픽셀이 포함될 수 있습니다. 클라우드 지수의 임계값을 조정하고 차트로 표시된 시계열을 관찰하여 이 임계값이 결과에 어떤 영향을 미치는지 알아봅니다.
이미지 내보내기
Earth Engine에서 계산한 데이터의 차트를 내보내는 방법을 살펴봤습니다. 전체 이미지는 어떻게 내보낼까요? 예를 들어 이전 섹션에서 설명한 대로 가장 녹색인 픽셀 합성 이미지를 빌드했다고 가정해 보겠습니다.
코드 편집기 (JavaScript)
var greenest = cloudlessNDVI.qualityMosaic('NDVI');
이 코드와 이전에 사용한 코드의 유일한 차이점은 이제 클라우드 마스크 처리된 컬렉션을 사용한다는 것입니다. Export 패키지를 사용하여 이 데이터의 하위 집합 (리전으로 정의됨)을 내보낼 수 있습니다. (Earth Engine에서 래스터 및 벡터 데이터 내보내기 자세히 알아보기) 예를 들어 다른 문서에 쉽게 삽입할 수 있는 이미지를 내보내려면 이전에 했던 것처럼 시각화 이미지를 만들고 Google Drive 폴더로 내보냅니다.
코드 편집기 (JavaScript)
// Create a 3-band, 8-bit, color-IR composite to export.
var visualization = greenest.visualize({
  bands: ['B5', 'B4', 'B3'],
  max: 0.4
});

// Create a task that you can launch from the Tasks tab.
Export.image.toDrive({
  image: visualization,
  description: 'Greenest_pixel_composite',
  scale: 30
});
이 코드를 실행하면 작업 탭에 새 작업이 생성됩니다. 내보내기 구성 대화상자를 실행하려면 작업 탭에서 실행 버튼을 클릭합니다. 작업을 구성한 후 대화상자에서 실행 버튼을 클릭하여 내보내기를 시작합니다. 하지만 그 전에 다음 사항을 주의하세요.
region 인수를 사용하지 않고 내보낼 때 주의해야 하는 이유는 scale 값을 비교적 작은 값으로 설정하고 지도를 넓은 영역으로 축소하면 매우 큰 이미지가 Drive 폴더로 내보내질 수 있기 때문입니다. 자세한 내용과 가능한 구성 매개변수 목록은 문서 탭의 Export.image.toDrive() 문서를 참고하세요.
이상으로 Earth Engine API 소개를 마칩니다. 이제 가장 일반적인 Earth Engine 기능을 많이 살펴봤으므로 더 복잡한 분석을 자신 있게 진행할 수 있습니다. 문서를 읽고 포럼에서 다른 질문에 대한 답변을 검색하세요. 즐겁게 코딩해 보세요!